

HOT TOPICS LIST
- MACD
- Fibonacci
- RSI
- Gann
- ADXR
- Stochastics
- Volume
- Triangles
- Futures
- Cycles
- Volatility
- ZIGZAG
- MESA
- Retracement
- Aroon
INDICATORS LIST
LIST OF TOPICS
PRINT THIS ARTICLE
by Koos van der Merwe
On November 13, the Dow Jones Industrial Average started the day by testing the low of October 10. It then reversed upward, strongly forming a key reversal. Does this signify the completion of wave C?
Position: Accumulate
Koos van der Merwe
Has been a technical analyst since 1969, and has worked as a futures and options trader with First Financial Futures in Johannesburg, South Africa.
PRINT THIS ARTICLE
REVERSAL
The Dow And A Key Reversal
11/17/08 10:20:24 AMby Koos van der Merwe
On November 13, the Dow Jones Industrial Average started the day by testing the low of October 10. It then reversed upward, strongly forming a key reversal. Does this signify the completion of wave C?
Position: Accumulate
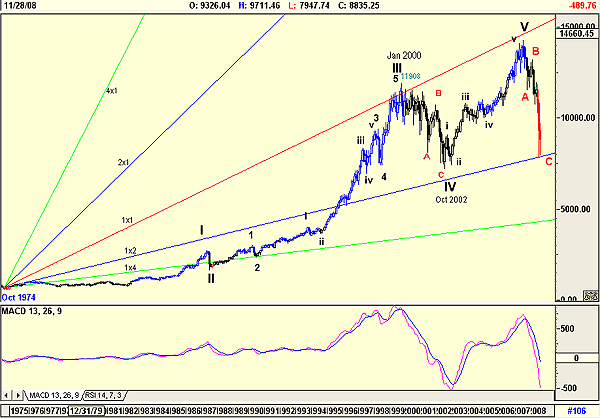
| Thursday, November 13 started out with the Dow Jones Industrial Average (DJIA) flirting with turning positive, or continuing its negative trend of Wednesday, November 12. It was another wild day, something the market currently seems to take in its stride. The DJIA rallied about 100 points after the opening bell, dropped to -60 points 30 minutes later, rebounded to about +120 by 10 am Eastern time, and then slid to -313 around 1 pm, hitting a low of 7969. Then, as though in response to the short speech that President George Bush made, it blasted upward to 8835, or +550 points, by the close. Remarkable, but with the volatility found in the market lately, not that spectacular, until one starts to analyze the technicals. When the market fell to the low of 7969, it bounced off the 2 x 1 Gann angle line. As shown on the monthly chart in Figure 1, the low of 7773.71 reached on October 31 also tested this Gann line, and thus gave the angle a strong support level. |
|
| FIGURE 1: DJIA, MONTHLY. DJIA shows the testing of the 1x2 Gann angle. |
| Graphic provided by: AdvancedGET. |
| |
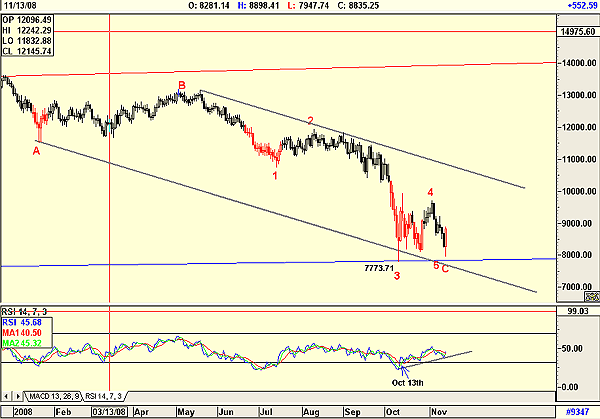
| A look at the daily chart (Figure 2) shows that the DJIA did not reach the 2x1 Gann angle, but it came very close. It also did not reach the trendline shown on the chart, but there are two very positive indications that the DJIA may indeed have completed its C wave: |
|
| FIGURE 2: DJIA, DAILY.The DJIA shows a key reversal and the RSI buy signal. |
| Graphic provided by: AdvancedGET. |
| |
| a. The day's move formed a key reversal. That is where the low of the day is lower than the previous day's low, and the high of the day is above the previous day's high, with the close at the previous day's high. b. The relative strength index (RSI) is trending upward, having given a buy signal on October 13, when it broke above the 32 horizontal line. Whether this level is indeed the completion of the C wave down will be confirmed over the next few days, but for the first time in a very nasty bear market, hope does seem justified, strengthened by the key reversal. |
Has been a technical analyst since 1969, and has worked as a futures and options trader with First Financial Futures in Johannesburg, South Africa.
| Address: | 3256 West 24th Ave |
| Vancouver, BC | |
| Phone # for sales: | 6042634214 |
| E-mail address: | petroosp@gmail.com |
Click here for more information about our publications!
Comments
Date:�11/18/08Rank:�5Comment:�
Date:�11/18/08Rank:�5Comment:�

Request Information From Our Sponsors
- StockCharts.com, Inc.
- Candle Patterns
- Candlestick Charting Explained
- Intermarket Technical Analysis
- John Murphy on Chart Analysis
- John Murphy's Chart Pattern Recognition
- John Murphy's Market Message
- MurphyExplainsMarketAnalysis-Intermarket Analysis
- MurphyExplainsMarketAnalysis-Visual Analysis
- StockCharts.com
- Technical Analysis of the Financial Markets
- The Visual Investor
- VectorVest, Inc.
- Executive Premier Workshop
- One-Day Options Course
- OptionsPro
- Retirement Income Workshop
- Sure-Fire Trading Systems (VectorVest, Inc.)
- Trading as a Business Workshop
- VectorVest 7 EOD
- VectorVest 7 RealTime/IntraDay
- VectorVest AutoTester
- VectorVest Educational Services
- VectorVest OnLine
- VectorVest Options Analyzer
- VectorVest ProGraphics v6.0
- VectorVest ProTrader 7
- VectorVest RealTime Derby Tool
- VectorVest Simulator
- VectorVest Variator
- VectorVest Watchdog