HOT TOPICS LIST
- MACD
- Fibonacci
- RSI
- Gann
- ADXR
- Stochastics
- Volume
- Triangles
- Futures
- Cycles
- Volatility
- ZIGZAG
- MESA
- Retracement
- Aroon
INDICATORS LIST
LIST OF TOPICS
PRINT THIS ARTICLE
by Donald W. Pendergast, Jr.
After making a new low today, the NYSE Composite index staged a major turnaround. But is this truly the end of the major downtrend that began a year ago?
Position: Accumulate
Donald W. Pendergast, Jr.
Donald W. Pendergast is a financial markets consultant who offers specialized services to stock brokers and high net worth individuals who seek a better bottom line for their portfolios.
PRINT THIS ARTICLE
VOLUME
Is This The Bottom For The NYSE Composite?
11/17/08 12:34:59 PMby Donald W. Pendergast, Jr.
After making a new low today, the NYSE Composite index staged a major turnaround. But is this truly the end of the major downtrend that began a year ago?
Position: Accumulate
| The year 2008 has been an exercise in patience for most investors, as each call for an end to the bear market has been violently shrugged off by the most vicious market plunge in nearly 80 years. As a key barometer of the broad market's strength, the .NYA has painted a picture of failing health and poverty for the millions who have their IRA and 401K funds deployed into its component stocks. Today, however, may have marked a turning point, a timeout if you will, one that suggests that an upside reversal could be in the cards. Let's start with the monthly chart (Figure 1) and drill down from there. |

|
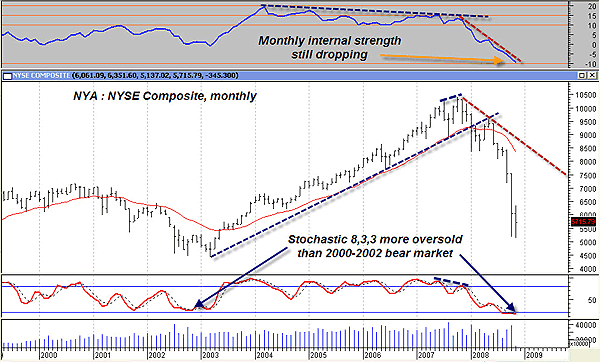
| FIGURE 1: NYSE COMPOSITE, MONTHLY. The monthly stochastic is near a record low. |
| Graphic provided by: MetaStock. |
| |
| The big picture is best derived from long-term graphs, and the NYSE Composite's (NYA) monthly chart tells us that the stochastic is the most oversold in decades, as are the internal strength readings (gray panel at top of chart). That in itself isn't sufficient evidence to begin accumulating stock, but it may be warning of an impending reversal, one triggered by a short-squeeze that could easily drive the NYSE Composite up by a substantial amount. Price has also respected the 5000 level so far, which is a good thing, because the next significant support zone lies far below at 4419. |

|
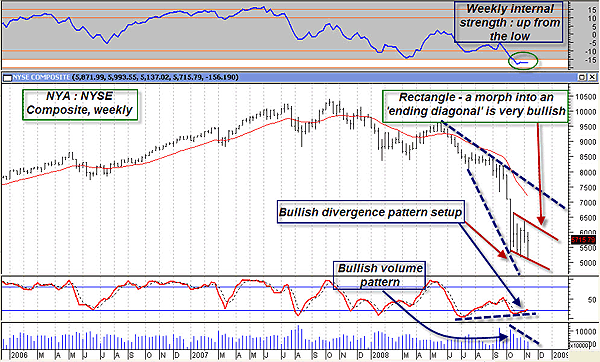
| FIGURE 2: NYSE COMPOSITE, WEEKLY. Several indicators suggest that the NYA is near a major low. |
| Graphic provided by: MetaStock. |
| |
| On the weekly side (Figure 2), the internal strength has already made its move up from the lows, bullish volume and stochastic (8,3,3) patterns are in the process and a rectangle of some degree is beginning to take shape. Those who are familiar with Elliott wave theory know that one of the most powerful bullish reversal signals occurs when an ending diagonal triangle forms after a move that has gone, in the words of Elliott, "too far, too fast."" While no one knows if this pattern will actually form, if it does, the move up and out of it should be very powerful. |

|
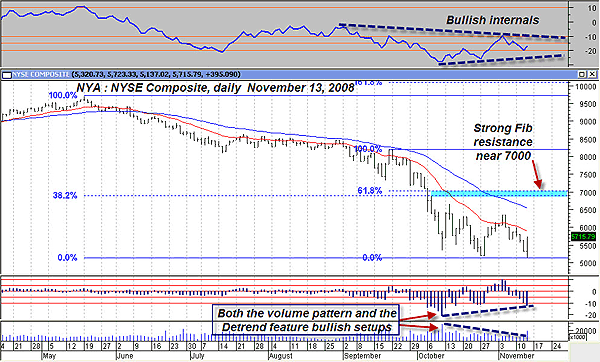
| FIGURE 3: NYSE COMPOSITE, DAILY. The daily chart paints the most convincing image of a trend in transition. |
| Graphic provided by: MetaStock. |
| Graphic provided by: WB Detrend EOD from ProfitTrader for MetaStock. |
| |
| Finally, the daily chart (Figure 3). This clearly displays strong evidence that a low is indeed forming; in fact, the pattern of the three significant daily lows is eerily reminiscent of the three weekly lows that printed on the NYA in July 2002, October 2002, and March 2003, just before a huge bull move began. If we do get a nice rally, expect the 7000 area to act as very strong resistance. Meanwhile, the internal strength indicator has already formed a nice series of higher highs and higher lows, the declining volume trend is bullish, and so is the general shape of the detrend oscillator. While a major rally may take some time to occur, at least the market appears to have taken a breather and now appears to have traced out a consolidation pattern that should give millions of burned investors pause for hope and thanksgiving. |
| Using the charts from the monthly, weekly,and daily time frames helps investors and traders get the big picture of the current state of any given market. For example, had you only looked at the monthly chart of the NYA, you'd have missed out on the exciting trend-reversal signals that are beginning to converge on the daily chart. Focusing solely on one time frame can be extremely hazardous to your financial health; in fact, you should always look at the internal strength across three time frames (daily, weekly, and monthly, if trading a daily time frame) before you place any trade or commit funds to any investment. Realize, too, that every trend reversal must, by definition, begin in the lower time frames, so don't always expect to have valid confirmation from higher time frames when trading such reversals. |
Donald W. Pendergast is a financial markets consultant who offers specialized services to stock brokers and high net worth individuals who seek a better bottom line for their portfolios.
| Title: | Writer, market consultant |
| Company: | Linear Trading Systems LLC |
| Jacksonville, FL 32217 | |
| Phone # for sales: | 904-239-9564 |
| E-mail address: | lineartradingsys@gmail.com |
Traders' Resource Links | |
| Linear Trading Systems LLC has not added any product or service information to TRADERS' RESOURCE. | |
Click here for more information about our publications!
Comments
Date: 11/18/08Rank: 5Comment:

Request Information From Our Sponsors
- StockCharts.com, Inc.
- Candle Patterns
- Candlestick Charting Explained
- Intermarket Technical Analysis
- John Murphy on Chart Analysis
- John Murphy's Chart Pattern Recognition
- John Murphy's Market Message
- MurphyExplainsMarketAnalysis-Intermarket Analysis
- MurphyExplainsMarketAnalysis-Visual Analysis
- StockCharts.com
- Technical Analysis of the Financial Markets
- The Visual Investor
- VectorVest, Inc.
- Executive Premier Workshop
- One-Day Options Course
- OptionsPro
- Retirement Income Workshop
- Sure-Fire Trading Systems (VectorVest, Inc.)
- Trading as a Business Workshop
- VectorVest 7 EOD
- VectorVest 7 RealTime/IntraDay
- VectorVest AutoTester
- VectorVest Educational Services
- VectorVest OnLine
- VectorVest Options Analyzer
- VectorVest ProGraphics v6.0
- VectorVest ProTrader 7
- VectorVest RealTime Derby Tool
- VectorVest Simulator
- VectorVest Variator
- VectorVest Watchdog
