HOT TOPICS LIST
- MACD
- Fibonacci
- RSI
- Gann
- ADXR
- Stochastics
- Volume
- Triangles
- Futures
- Cycles
- Volatility
- ZIGZAG
- MESA
- Retracement
- Aroon
INDICATORS LIST
LIST OF TOPICS
PRINT THIS ARTICLE
by James Kupfer
Along with all the major US market averages, the NASDAQ tracking stock QQQQ has formed a bullish engulfing candlestick pattern.
Position: Buy
James Kupfer
Mr. Kupfer is a market professional and amateur stock market commentator. Disclosure: It is likely that Mr. Kupfer has or will enter a position in any security he writes about.
PRINT THIS ARTICLE
CANDLESTICK CHARTING
QQQQ Engulfing Pattern
11/14/08 12:14:01 PMby James Kupfer
Along with all the major US market averages, the NASDAQ tracking stock QQQQ has formed a bullish engulfing candlestick pattern.
Position: Buy
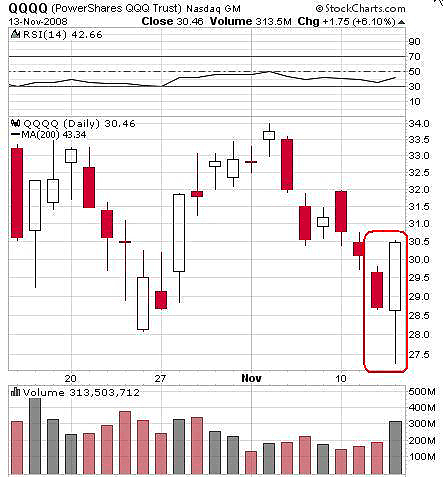
| Candlestick patterns are used by a variety of technical traders. Thursday's price action in all the major US equity indexes formed what is referred to as a bullish engulfing pattern. Although it would be unwise to make trading decisions based solely on the presence of a candlestick formation, this particular formation is thought to be a harbinger of a rise in prices just as the name would suggest. |

|
| FIGURE 1: QQQQ, DAILY. Note the engulfing pattern circled in red. |
| Graphic provided by: StockCharts.com. |
| |
| The bullish engulfing pattern is formed when a down day is "engulfed" completely, as in the following day's price action. In this particular case, Wednesday November 12 was a down day (Figure 1). On November 13 the QQQQs closed well above the previous day's high. In addition, the low of the day was significantly lower than the low of the day before. The engulfing pattern is circled in red. |
Mr. Kupfer is a market professional and amateur stock market commentator. Disclosure: It is likely that Mr. Kupfer has or will enter a position in any security he writes about.
Click here for more information about our publications!
Comments
Date: 11/18/08Rank: 3Comment:

Request Information From Our Sponsors
- StockCharts.com, Inc.
- Candle Patterns
- Candlestick Charting Explained
- Intermarket Technical Analysis
- John Murphy on Chart Analysis
- John Murphy's Chart Pattern Recognition
- John Murphy's Market Message
- MurphyExplainsMarketAnalysis-Intermarket Analysis
- MurphyExplainsMarketAnalysis-Visual Analysis
- StockCharts.com
- Technical Analysis of the Financial Markets
- The Visual Investor
- VectorVest, Inc.
- Executive Premier Workshop
- One-Day Options Course
- OptionsPro
- Retirement Income Workshop
- Sure-Fire Trading Systems (VectorVest, Inc.)
- Trading as a Business Workshop
- VectorVest 7 EOD
- VectorVest 7 RealTime/IntraDay
- VectorVest AutoTester
- VectorVest Educational Services
- VectorVest OnLine
- VectorVest Options Analyzer
- VectorVest ProGraphics v6.0
- VectorVest ProTrader 7
- VectorVest RealTime Derby Tool
- VectorVest Simulator
- VectorVest Variator
- VectorVest Watchdog
