HOT TOPICS LIST
- MACD
- Fibonacci
- RSI
- Gann
- ADXR
- Stochastics
- Volume
- Triangles
- Futures
- Cycles
- Volatility
- ZIGZAG
- MESA
- Retracement
- Aroon
INDICATORS LIST
LIST OF TOPICS
PRINT THIS ARTICLE
by Ron Walker
The intraday charts magnify the short-term tug-of-wars between the bulls and the bears that causes day-to-day price fluctuations. The intraday charts provide a swing trader a wealth of information, such as key levels of support and resistance. But the intraday charts also give clues of potential future price swings as chart patterns form. When a reversal develops off of a key level of support in the intraday time frame, it could be signaling that the bears are running out of gas. Multiple time frames give traders multiple clues in order to help determine future price direction.
Position: N/A
Ron Walker
Ron Walker is an active trader and technical analyst. He operates an educational website dedicated to the study of Technical Analysis. The website offers free market analysis with daily video presentations and written commentaries. Ron is a video pioneer, being one of the first to utilize the internet producing Technical Analysis videos. His website is thechartpatterntrader.com
PRINT THIS ARTICLE
SUPPORT & RESISTANCE
The DJIA's Test Of Support
11/14/08 09:32:05 AMby Ron Walker
The intraday charts magnify the short-term tug-of-wars between the bulls and the bears that causes day-to-day price fluctuations. The intraday charts provide a swing trader a wealth of information, such as key levels of support and resistance. But the intraday charts also give clues of potential future price swings as chart patterns form. When a reversal develops off of a key level of support in the intraday time frame, it could be signaling that the bears are running out of gas. Multiple time frames give traders multiple clues in order to help determine future price direction.
Position: N/A
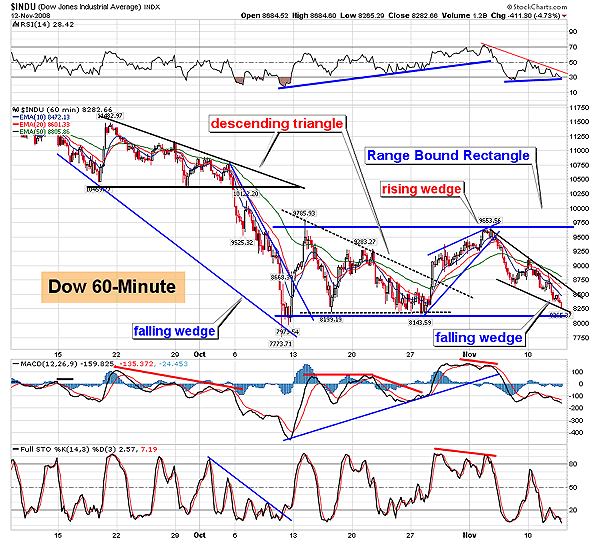
| Just after the US Labor Day in early September, with the economy in economic plight, the major averages all started showing signs of weakness in the stock market. The first leg lower of selling took place in early September, but during the second part of that month prices stopped to take a breather, forming a consolidation until early October. Unfortunately for the bulls, prices moved in a lateral direction, forming a bearish descending triangle, as seen on the Dow Jones Industrial Average's 60-minute chart (Figure 1). The pattern ran its course and broke down on October 6 as the DJIA put in its worst week in history over the next five days. The DJIA lost a staggering 1,874 points or 18.15 % that week. Once the DJIA hit bottom on October 10, prices began to move sideways again. Another bearish descending triangle pattern ultimately emerged throughout that consolidation phase. |

|
| FIGURE 1: DJIA, HOURLY. On the 60-minute chart we see a barrage of chart patterns that have for the most part accurately determined price direction. Note how the lower boundary of the bullish falling wedge is quickly approaching the October lows as it tests key support. If the October support level is violated it will cause significant technical damage. |
| Graphic provided by: StockCharts.com. |
| |
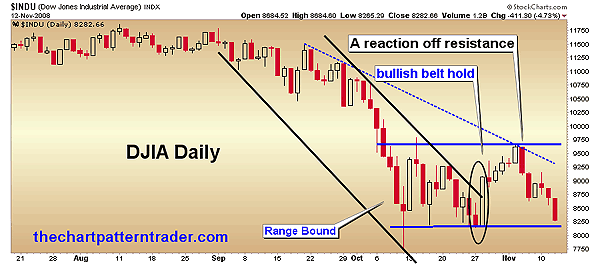
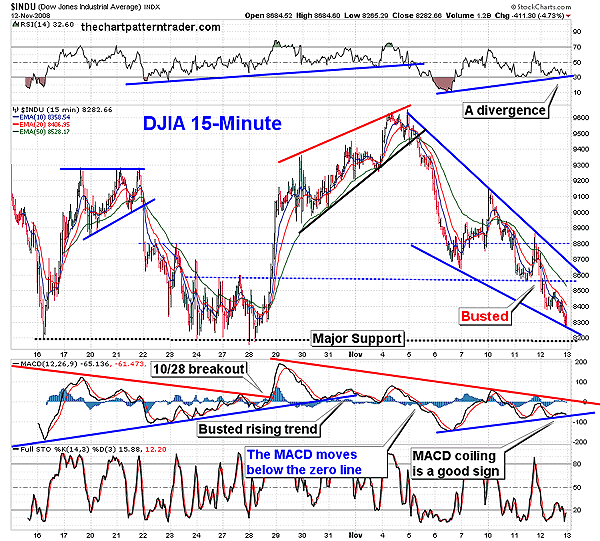
| Then on October 28, a reversal occurred on the DJIA as a bullish belt hold candlestick took hold of the DJIA's daily chart (Figure 2) as it soared 10.88 % higher in just one trading session. The candlestick reversal marked two important events. First, it broke the declining trendline in the DJIA's falling price channel. The falling price channel had been in place over the course of the selloff throughout September and October. Second, the belt hold reversal candle pattern negated the bearish descending triangle that had been looming over the price chart by plowing into the upper boundary of the triangle breaking above resistance. Prices advanced over the next six trading sessions forming a bearish rising wedge pattern on the 15-minute chart (Figure 3), where the DJIA ran into resistance on the daily chart. Two minor peaks that formed in late September, forming a downward trendline of resistance (Figure 2). Slamming into that trendline on the daily chart in conjunction with the rising wedge pattern on the 15-minute chart was too much of a barrier for the bulls to overcome, and the following day prices broke down on November 5. The reaction caused the DJIA to plunge lower for the next two days, marking its worst two-day percentage drop since October 1987, losing a hefty 900-plus points or just over 9%. |

|
| FIGURE 2: DJIA, DAILY. After a freefall throughout September and October, the DJIA started to consolidate sideways, forming a bearish descending triangle. But a bullish belt hold candlestick catapulted above the descending triangle's upper boundary, successfully defusing that ticking time bomb. Prices then advanced higher until they stalled and got a reaction off the downward trendline from the minor highs made in late September. |
| Graphic provided by: StockCharts.com. |
| |
| That drop caused the DJIA to violate its first level of support seen on the 15-minute chart (Figure 3) just below 8800. The DJIA then attempted a recovery, but prices were still too feeble to start a new advance. In Figure 3, prices started to unravel again as they got a jolt from the bears that nudged the DJIA down to its next level of support at 8550. But the 8550 level of support broke down on November 12, causing the DJIA to shed another 411 points or 4.73%. The push lower did allow a bullish chart pattern to crop up; this is known as a falling wedge pattern. Chart patterns are psychological road maps of investor sentiment, having a proven track record of reliability. So the probability of a bounce off key support made during the October between 8150 to 8200 is very high. But if that level is penetrated,the DJIA could test its October intraday low of 7973. However, it is encouraging to note that the lower boundary of the falling wedge pattern formed a divergence with the relative strength index (RSI) (14) on the DJIA 15-minute chart. That may allow the falling wedge pattern to break out to the upside soon. |

|
| FIGURE 3: DJIA, 15-MINUTE. Here the DJIA is attempting to carve out a bullish falling pattern just above the October lows. |
| Graphic provided by: StockCharts.com. |
| |
| While the 15-minute chart is busy carving out a falling wedge pattern, the 60-minute chart is testing the lower boundary in a rectangle pattern (Figure 1). The market is rangebound as the DJIA continues to move in a lateral range approximately between 8150 to 9650. We could see prices snap back up to test the upper boundary of the rectangle pattern on the 60-minute chart near the 9650 area. Should this occur, it would diminish the enormous amount of volatility that has been lurking over the stock market. The market is very oversold at these levels. Whether the rectangle pattern (Figure 2) holds up largely depends on the pace of the economic recovery, corporate earnings, and if the bulls can regain unfettered control of the market. If the rectangle pattern breaks to the downside, we should expect the previous bearish trend to reassert itself. The bulls need to score a couple of touchdowns in order to turn the DJIA around; up until now all they have been successful in doing is scoring a couple of field goals. |
Ron Walker is an active trader and technical analyst. He operates an educational website dedicated to the study of Technical Analysis. The website offers free market analysis with daily video presentations and written commentaries. Ron is a video pioneer, being one of the first to utilize the internet producing Technical Analysis videos. His website is thechartpatterntrader.com
| Website: | thechartpatterntrader.com |
| E-mail address: | thechartpatterntrader@gmail.com |
Click here for more information about our publications!
Comments
Date: 11/18/08Rank: 5Comment:
Date: 11/23/08Rank: 5Comment:

Request Information From Our Sponsors
- VectorVest, Inc.
- Executive Premier Workshop
- One-Day Options Course
- OptionsPro
- Retirement Income Workshop
- Sure-Fire Trading Systems (VectorVest, Inc.)
- Trading as a Business Workshop
- VectorVest 7 EOD
- VectorVest 7 RealTime/IntraDay
- VectorVest AutoTester
- VectorVest Educational Services
- VectorVest OnLine
- VectorVest Options Analyzer
- VectorVest ProGraphics v6.0
- VectorVest ProTrader 7
- VectorVest RealTime Derby Tool
- VectorVest Simulator
- VectorVest Variator
- VectorVest Watchdog
- StockCharts.com, Inc.
- Candle Patterns
- Candlestick Charting Explained
- Intermarket Technical Analysis
- John Murphy on Chart Analysis
- John Murphy's Chart Pattern Recognition
- John Murphy's Market Message
- MurphyExplainsMarketAnalysis-Intermarket Analysis
- MurphyExplainsMarketAnalysis-Visual Analysis
- StockCharts.com
- Technical Analysis of the Financial Markets
- The Visual Investor
