HOT TOPICS LIST
- MACD
- Fibonacci
- RSI
- Gann
- ADXR
- Stochastics
- Volume
- Triangles
- Futures
- Cycles
- Volatility
- ZIGZAG
- MESA
- Retracement
- Aroon
INDICATORS LIST
LIST OF TOPICS
PRINT THIS ARTICLE
by Donald W. Pendergast, Jr.
Although the stocks in the natural gas industry group have fallen sharply, they, along with natural gas futures, may be near critical support.
Position: Accumulate
Donald W. Pendergast, Jr.
Donald W. Pendergast is a financial markets consultant who offers specialized services to stock brokers and high net worth individuals who seek a better bottom line for their portfolios.
PRINT THIS ARTICLE
REL. STR COMPARATIVE
Natural Gas, Equities Nearing Major Support
11/13/08 09:04:58 AMby Donald W. Pendergast, Jr.
Although the stocks in the natural gas industry group have fallen sharply, they, along with natural gas futures, may be near critical support.
Position: Accumulate
| Every so often, wise commodity traders pull out their trusty seasonal chart books — you know, the ones that can show you at what times of the year any given commodity will usually be near the high or low of its annual price range. It's exciting to anticipate the start of an expected bull or bear run in a given commodity, especially in natural gas, which has an excellent 15-year track record of making a seasonal low in July before rallying hard into late October. It almost looked like a sure trade — until this year. A rally? Forget it! Prices plunged nearly 50% during a supposedly bullish seasonal period. |

|
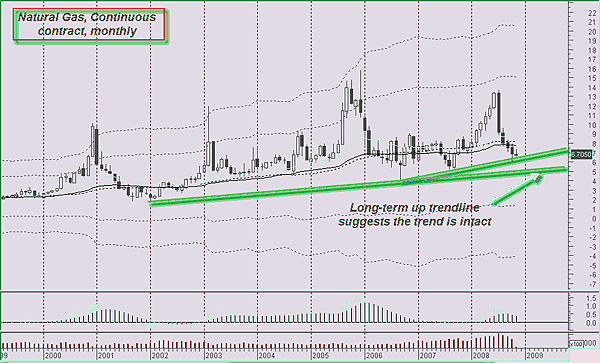
| FIGURE 1: NATURAL GAS, MONTHLY. Natural gas is approaching key support levels. |
| Graphic provided by: MetaStock. |
| |
| The monthly chart of natural gas futures depicts the three consecutive higher highs/higher lows made during 2000–05 before chopping around in 2006–07 (Figure 1). The rally earlier this year was sure and steady, but lacked the punch needed to even touch the first Keltner band. In a perverse seasonal reversal, prices did a complete 180-degree flip-flop from the anticipated guidance offered on the seasonal chart, dropping nearly 50% in four months. Right now, however, downward momentum is slowing even as natural gas attempts to find support at its extended up trendline. If price turns higher, forming a higher low, the upward progression of this vital energy commodity may continue, as the extreme long-term trendline is still intact. |

|
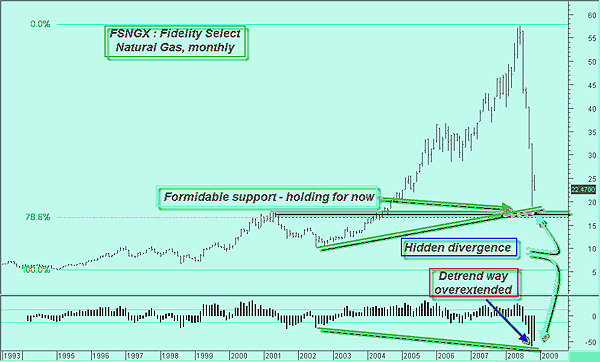
| FIGURE 2: FIDELITY SELECT NATURAL GAS, MONTHLY. Are natural gas equities due for a serious reaction higher? |
| Graphic provided by: MetaStock. |
| Graphic provided by: WB Detrend EOD from Profit Trader for MetaStock. |
| |
| Natural gas equities got mashed even harder than natural gas did, tanking by almost 65% in four months. I have rarely seen a sharper plunge in any industry group than that depicted by this monthly Fidelity Select Natural Gas (FSNGX) chart (Figure 2). However, for every action, there is an equal and opposite reaction, and since FSNGX is so close to the critical 78.6% Fibonacci level and another major support barrier, we may see some violent price action near the 16.50–17.60 zone. The WB detrend is sharply extended, implying a bounce and/or possible short-covering rally if it snaps back. Finally, note the pronounced hidden divergence relationship between price and the detrend oscillator, a potentially bullish setup. |

|
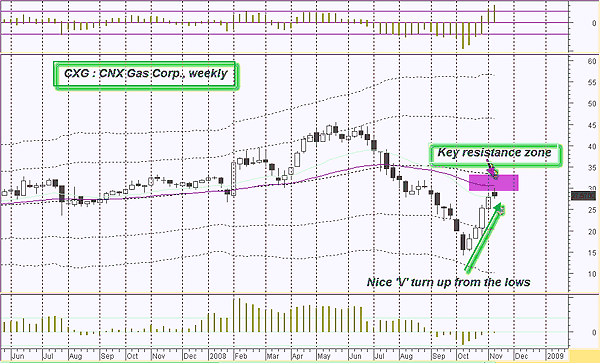
| FIGURE 3: CXG, WEEKLY. CNX Gas Corp. prints a sharp V bottom in October 2008. |
| Graphic provided by: MetaStock. |
| |
| Going further, I ran a 13-week relative strength comparison of FSNGX versus a group of natural gas producers and found that CNX Gas Corp. is outperforming the rest of its peer group (Figure 3). Up almost 100% from its October low, CXG is now approaching key resistance in the 30.50–31.75 range, right near the 50-week exponential moving average (EMA) and the August high. Given this stock's unusual strength in the midst of slouching natural gas prices, CXG could be an equity to keep an eye on. |
| Seasonally based commodity trading is not a "sure-thing" pastime that always guarantees a winning trade, although seasonal charts do have a place in the arsenal of the serious commodity trader. In this article we also used relative strength analysis to uncover a potential long stock candidate, one hiding amid the rubble of a major industry group price rout. Taking advantage of both seasonal charts and relative strength analysis can help give you an upper hand, no matter what markets you trade. |
Donald W. Pendergast is a financial markets consultant who offers specialized services to stock brokers and high net worth individuals who seek a better bottom line for their portfolios.
| Title: | Writer, market consultant |
| Company: | Linear Trading Systems LLC |
| Jacksonville, FL 32217 | |
| Phone # for sales: | 904-239-9564 |
| E-mail address: | lineartradingsys@gmail.com |
Traders' Resource Links | |
| Linear Trading Systems LLC has not added any product or service information to TRADERS' RESOURCE. | |
Click here for more information about our publications!
Comments

|

Request Information From Our Sponsors
- StockCharts.com, Inc.
- Candle Patterns
- Candlestick Charting Explained
- Intermarket Technical Analysis
- John Murphy on Chart Analysis
- John Murphy's Chart Pattern Recognition
- John Murphy's Market Message
- MurphyExplainsMarketAnalysis-Intermarket Analysis
- MurphyExplainsMarketAnalysis-Visual Analysis
- StockCharts.com
- Technical Analysis of the Financial Markets
- The Visual Investor
- VectorVest, Inc.
- Executive Premier Workshop
- One-Day Options Course
- OptionsPro
- Retirement Income Workshop
- Sure-Fire Trading Systems (VectorVest, Inc.)
- Trading as a Business Workshop
- VectorVest 7 EOD
- VectorVest 7 RealTime/IntraDay
- VectorVest AutoTester
- VectorVest Educational Services
- VectorVest OnLine
- VectorVest Options Analyzer
- VectorVest ProGraphics v6.0
- VectorVest ProTrader 7
- VectorVest RealTime Derby Tool
- VectorVest Simulator
- VectorVest Variator
- VectorVest Watchdog
