HOT TOPICS LIST
- MACD
- Fibonacci
- RSI
- Gann
- ADXR
- Stochastics
- Volume
- Triangles
- Futures
- Cycles
- Volatility
- ZIGZAG
- MESA
- Retracement
- Aroon
INDICATORS LIST
LIST OF TOPICS
PRINT THIS ARTICLE
by David Penn
In spite of the Airlines Index's three-day rally to end the first half of the year, the sector is not yet cleared for take-off.
Position: N/A
David Penn
Technical Writer for Technical Analysis of STOCKS & COMMODITIES magazine, Working-Money.com, and Traders.com Advantage.
PRINT THIS ARTICLE
SUPPORT & RESISTANCE
Rising Toward Resistance
07/02/01 12:16:16 PMby David Penn
In spite of the Airlines Index's three-day rally to end the first half of the year, the sector is not yet cleared for take-off.
Position: N/A
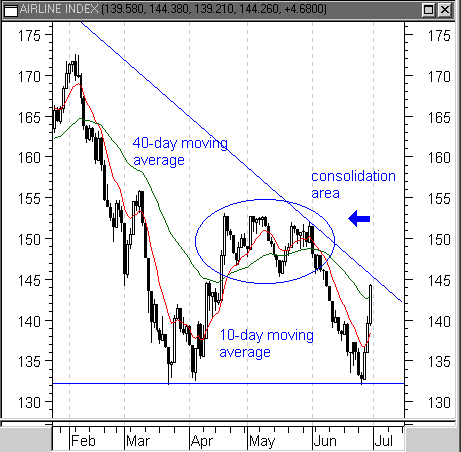
| It is hard to imagine a more auspicious beginning for an underperforming sector: the Airlines Index ($XAL), which has been in a downtrend since the beginning of the year, staged an impressive three-day rally to end the first half of the year, rising 10% from year-to-date lows late in June. Almost on cue, Barrons magazine's July 2nd edition featured Southwest Airlines (LUV) on the cover, hailing the airline as one of the few diamonds in an otherwise rough industry. In fact, the chart of the Airlines Index looks remarkably similar to the Dow Jones Transportation Average, which also finished the second quarter with a three-day rally. |
| Unfortunately, the skies above the Airlines Index are quite cloudy. A six-week consolidation pattern stretching from mid-April to the beginning of June threatens to make any continued advance very difficult for the $XAL. Not only does this congestion threaten a continued advance above 145, but also the six-month downtrend line cast at the beginning of the year looks equally likely to challenge any sustained rally. This downtrend line, for example, marked the beginning of the June decline in $XAL, when the Index fell 13%. |

|
| Figure 1: A strong end of the quarter rally, but $XAL has much more work to do before any real upside is likely. |
| Graphic provided by: MetaStock. |
| |
| A pair of moving averages, a 10-day and a 40-day simple moving average, emphasize the overall downtrend in which the Index has moved. Particularly disheartening for airline bulls is the fact that the shorter moving average, the 10-day, is leading the longer moving average downward. This suggests that the Index is deteriorating at an accelerating rate. |
| One reason for taking a look at the Airline Index has to do with its relationship to the Transportation industry and the role that transportation, traditionally, plays in the business cycle. If it is true, as many including John Murphy have suggested, that the transition from the late contraction phase of the business cycle to the early expansion phase of the business cycle is characterized by outperformance in consumer cyclicals and transportation, then studying one of the key components of the transportation industry, such as the airlines, may provide some clues as to where the market really stands vis-a-vis the business cycle. |
| A second reason for looking at the Airlines Index also has to do with its resemblance to the Dow Jones Transportation Average, and with comparisons being made between the DJT and the market-at-large. Essentially, some have looked to the DJT's spring trough and May consolidation for some clue as to how the rest of the market might perform. While I will discuss this latter-day Dow Theory in more detail in a subsequent piece, both the DJT and the broader markets will have to cope with a sizeable overhead of resistance--product of the spring advance and the early summer decline--if they are to move into truly higher ground. |
Technical Writer for Technical Analysis of STOCKS & COMMODITIES magazine, Working-Money.com, and Traders.com Advantage.
| Title: | Technical Writer |
| Company: | Technical Analysis, Inc. |
| Address: | 4757 California Avenue SW |
| Seattle, WA 98116 | |
| Phone # for sales: | 206 938 0570 |
| Fax: | 206 938 1307 |
| Website: | www.Traders.com |
| E-mail address: | DPenn@traders.com |
Traders' Resource Links | |
| Charting the Stock Market: The Wyckoff Method -- Books | |
| Working-Money.com -- Online Trading Services | |
| Traders.com Advantage -- Online Trading Services | |
| Technical Analysis of Stocks & Commodities -- Publications and Newsletters | |
| Working Money, at Working-Money.com -- Publications and Newsletters | |
| Traders.com Advantage -- Publications and Newsletters | |
| Professional Traders Starter Kit -- Software | |
Click here for more information about our publications!
Comments

Request Information From Our Sponsors
- StockCharts.com, Inc.
- Candle Patterns
- Candlestick Charting Explained
- Intermarket Technical Analysis
- John Murphy on Chart Analysis
- John Murphy's Chart Pattern Recognition
- John Murphy's Market Message
- MurphyExplainsMarketAnalysis-Intermarket Analysis
- MurphyExplainsMarketAnalysis-Visual Analysis
- StockCharts.com
- Technical Analysis of the Financial Markets
- The Visual Investor
- VectorVest, Inc.
- Executive Premier Workshop
- One-Day Options Course
- OptionsPro
- Retirement Income Workshop
- Sure-Fire Trading Systems (VectorVest, Inc.)
- Trading as a Business Workshop
- VectorVest 7 EOD
- VectorVest 7 RealTime/IntraDay
- VectorVest AutoTester
- VectorVest Educational Services
- VectorVest OnLine
- VectorVest Options Analyzer
- VectorVest ProGraphics v6.0
- VectorVest ProTrader 7
- VectorVest RealTime Derby Tool
- VectorVest Simulator
- VectorVest Variator
- VectorVest Watchdog
