HOT TOPICS LIST
- MACD
- Fibonacci
- RSI
- Gann
- ADXR
- Stochastics
- Volume
- Triangles
- Futures
- Cycles
- Volatility
- ZIGZAG
- MESA
- Retracement
- Aroon
INDICATORS LIST
LIST OF TOPICS
PRINT THIS ARTICLE
by Paolo Pezzutti
The dollar is developing a symmetrical triangle, which is a continuation pattern.
Position: Sell
Paolo Pezzutti
Author of the book "Trading the US Markets - A Comprehensive Guide to US Markets for International Traders and Investors" - Harriman House (July 2008)
PRINT THIS ARTICLE
ELLIOTT WAVE
Elliott Wave Bullish For US Dollar
11/12/08 08:42:43 AMby Paolo Pezzutti
The dollar is developing a symmetrical triangle, which is a continuation pattern.
Position: Sell
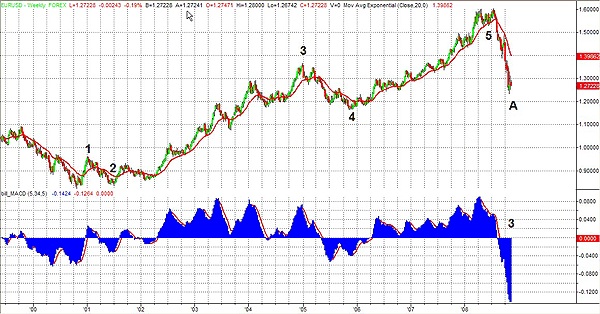
| The weekly chart of the US dollar vs the euro (EUR/USD) shown in Figure 1 displays an uptrend that brought prices from a low at about 0.82 in October 2000 to the high at about 1.60 in July 2008. The Elliott wave count in this time frame indicates that the five waves to the upside are completed. The subsequent move that started this summer could be interpreted as the wave A of a typical A-B-C correction. |

|
| FIGURE 1: EUR/USD, WEEKLY. The Elliott wave count displays that the five waves to the upside are completed. The EUR/USD is developing an A-B-C correction in this time frame. |
| Graphic provided by: TradeStation. |
| |
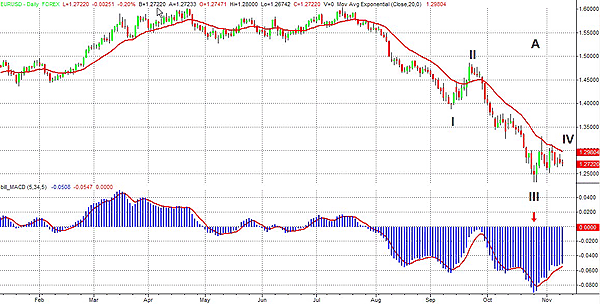
| Since last summer, prices developed their impressive action to the downside. In fact, in the daily chart in Figure 2 you can see that the moving average convergence/divergence (MACD) indicator, used to help interpret the Elliott wave count, displays a new low with the pivot low of prices printed at the end of October. According to this approach, the EUR/USD is developing a five-wave pattern in the daily time frame. Wave 3 is now completed and the current formation represents a wave 4. Therefore, we should see lower prices of the euro in the near future, at least to retest the level of 1.23. |

|
| FIGURE 2: EUR/USD, DAILY. The EUR/USD is developing a wave IV. We should see lower prices according to this count. |
| Graphic provided by: TradeStation. |
| |
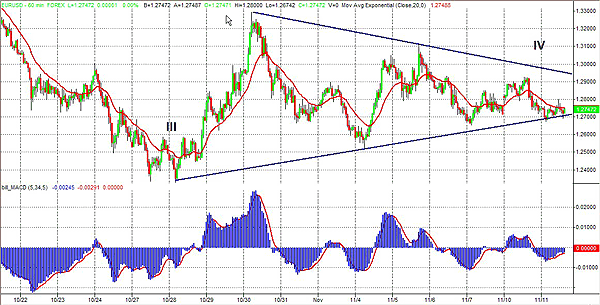
| This target for the EUR/USD is confirmed in the 60-minute time frame that you can see in Figure 3. Wave 4 is developing in the form of a symmetrical triangle. The symmetrical triangle is usually a continuation pattern. It represents a pause in the existing trend after which the original trend is resumed. Normally, prices should break out in the direction of the original trend between two-thirds and three-quarters of the triangle's width. The longer the prices remain within the triangle beyond these limits, the weaker the following move might be. To measure the objective of the move, you can consider the height of the widest part of the triangle (the initial part) and project it from the breakout point in the direction of the breakout. This would give an objective to the downside, should the breakout occur, at 1.19. In order to trade this type of formation, you can follow different approaches. In fact, you can trade the breakout of the trendline or you can wait for a pullback after the breakout. An alternative would be selling at resistance levels when prices retest the upper descending trendline. |

|
| FIGURE 3: EUR/USD, HOURLY. Prices are developing a symmetrical triangle with an objective at 1.19. |
| Graphic provided by: TradeStation. |
| |
| Trading the Elliott wave is not the holy grail. It may happen that, as the price action develops, the count has to be changed. However, this methodology is useful with which to build the big picture and understand the context and the trend in which you decide to open your position. Moreover, triangles are normally a reliable continuation formation, but they also can fail. Many traders, in fact, focus on these failures, which bring an increase in volatility as several traders get trapped on the wrong side of the market. How to plan your trade depends on your trading style. |
Author of the book "Trading the US Markets - A Comprehensive Guide to US Markets for International Traders and Investors" - Harriman House (July 2008)
| Address: | VIA ROBERTO AGO 26 POSTAL CODE 00166 |
| Rome, ITALY | |
| Phone # for sales: | +393357540708 |
| E-mail address: | pezzutti.paolo@tiscali.it |
Click here for more information about our publications!
Comments
Date: 11/18/08Rank: 4Comment:

Request Information From Our Sponsors
- StockCharts.com, Inc.
- Candle Patterns
- Candlestick Charting Explained
- Intermarket Technical Analysis
- John Murphy on Chart Analysis
- John Murphy's Chart Pattern Recognition
- John Murphy's Market Message
- MurphyExplainsMarketAnalysis-Intermarket Analysis
- MurphyExplainsMarketAnalysis-Visual Analysis
- StockCharts.com
- Technical Analysis of the Financial Markets
- The Visual Investor
- VectorVest, Inc.
- Executive Premier Workshop
- One-Day Options Course
- OptionsPro
- Retirement Income Workshop
- Sure-Fire Trading Systems (VectorVest, Inc.)
- Trading as a Business Workshop
- VectorVest 7 EOD
- VectorVest 7 RealTime/IntraDay
- VectorVest AutoTester
- VectorVest Educational Services
- VectorVest OnLine
- VectorVest Options Analyzer
- VectorVest ProGraphics v6.0
- VectorVest ProTrader 7
- VectorVest RealTime Derby Tool
- VectorVest Simulator
- VectorVest Variator
- VectorVest Watchdog
