HOT TOPICS LIST
- MACD
- Fibonacci
- RSI
- Gann
- ADXR
- Stochastics
- Volume
- Triangles
- Futures
- Cycles
- Volatility
- ZIGZAG
- MESA
- Retracement
- Aroon
INDICATORS LIST
LIST OF TOPICS
PRINT THIS ARTICLE
by Donald W. Pendergast, Jr.
Three distinct ratio views of gold suggest that silver and the stocks within XAU may soon outperform gold. Meanwhile, gold has trounced crude oil for more than four months.
Position: Accumulate
Donald W. Pendergast, Jr.
Donald W. Pendergast is a financial markets consultant who offers specialized services to stock brokers and high net worth individuals who seek a better bottom line for their portfolios.
PRINT THIS ARTICLE
REL. STR COMPARATIVE
Golden Ratios And Market Dynamics
11/11/08 09:27:25 AMby Donald W. Pendergast, Jr.
Three distinct ratio views of gold suggest that silver and the stocks within XAU may soon outperform gold. Meanwhile, gold has trounced crude oil for more than four months.
Position: Accumulate
| Ratio charts offer market technicians an uncommon view into the dynamic relationships between diverse market segments, and, when combined with knowledge of the key fundamental factors that drive such markets, such technicians are able to remain a step ahead of those who refuse to avail themselves of the big picture. Today's charts all center on gold, and each chart has something important to say about the relative strength of gold versus other important inflation-sensitive market segments. We'll start with the monthly gold/silver ratio chart. |

|
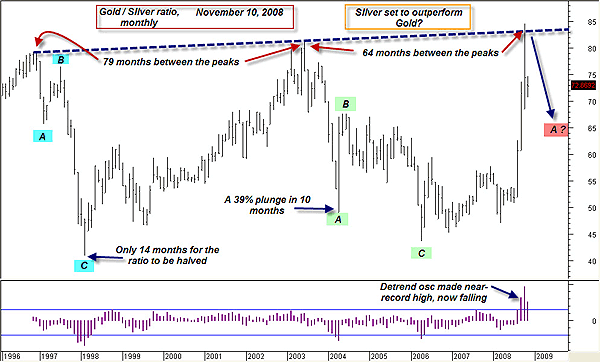
| FIGURE 1: GOLD/SILVER RATIO, MONTHLY. A major reversal in the gold/silver ratio may be under way. |
| Graphic provided by: MetaStock. |
| Graphic provided by: WB Detrend EOD from Profit Trader for MetaStock. |
| |
| Figure 1 says so much. The most vital message is that the gold to silver ratio appears to have turned squarely in favor of silver, and if past price behavior is a clue to the future, then we may well see a very sharp, swift plunge in the ratio over the next 10 to 14 months. Given that gold has been remarkably steady over the past month or so, this clearly indicates that silver is gaining momentum, which its price chart (not shown) confirms. The detrend oscillator, which was at a manic, unsustainable extreme, also seems to confirm that a major sea change is in the cards for this important ratio. Finally, note the time ratios between the three peaks; the first pair is separated by 79 months, which is essentially a Fibonacci ratio (78.6), while the second pair is separated by 64 months, which is also close to another key Fib ratio, the venerable 61.8. Numerology? Who knows, but it all paints a convincing picture that silver may be the metal to watch in the months to come. |

|
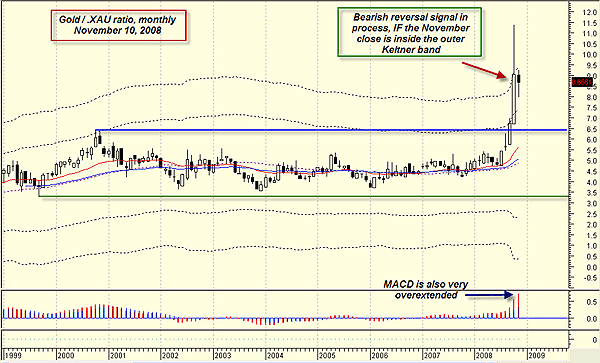
| FIGURE 2: GOLD/XAU RATIO, MONTHLY. Precious metals equities may soon outperform gold. |
| Graphic provided by: MetaStock. |
| |
| Now let's take a gander at the gold/XAU ratio, which displays the balance of power between gold and the gold and silver stocks that populate the Philadelphia Gold and Silver Index (Figure 2). From 1995 to August 2008, the gold/XAU ratio traded within a range of 2.60 to 6.40; in September 2008, however, the ratio broke sharply higher, clawing its way all the way to 11.38 last month. The monthly chart suggests that this rally is over as the huge reversal candle combined with an anticipated close back inside the outer Keltner band each confirm that a reversal may be at hand. |

|
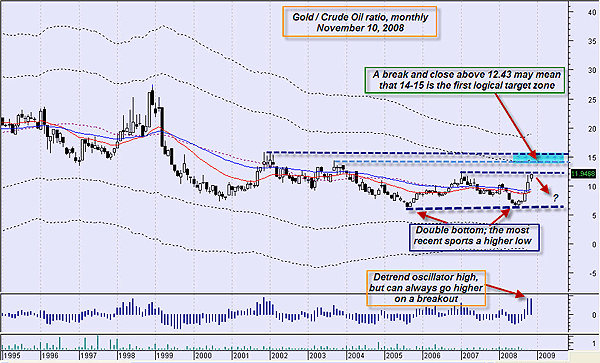
| FIGURE 3: GOLD/CRUDE OIL RATIO, MONTHLY. Still in a range, a break and close above 12.43 is bullish. |
| Graphic provided by: MetaStock. |
| Graphic provided by: WB Detrend EOD from Profit Trader for MetaStock. |
| |
| Finally, we examine the monthly gold/crude oil ratio chart (Figure 3). Evidence that gold is outperforming! Since 1989, the ratio between these two inflation-sensitive commodities has ranged between 6.18 and 27.85. Currently at 11.95 and rising, the evidence suggests that a break through and subsequent close above 12.43 will pave the way for more substantial ratio gains for the gold side of the equation. The detrend is very high, but the consecutive string of white candles also suggest that this uptrend may be impulsive and therefore due to go substantially higher. Of course, reversal traders may be able to bring the ratio back down into the current trading range, but the fact that the 20-month exponential moving average (EMA) looks ready to pierce the 50-month EMA does lend a distinctly bullish tone to this entire scenario. |
| Gold is a useful commodity. As a universally recognized monetary unit and store of value, it easily lends itself to the measurement of other key commodities and equities. Gold's value never changes; the only thing that changes is the number of units of other things needed to acquire a fixed amount of gold. Keep that in mind as you construct your own gold ratio charts of the stocks and commodities that you follow. You'll view the world in an entirely different light. |
Donald W. Pendergast is a financial markets consultant who offers specialized services to stock brokers and high net worth individuals who seek a better bottom line for their portfolios.
| Title: | Writer, market consultant |
| Company: | Linear Trading Systems LLC |
| Jacksonville, FL 32217 | |
| Phone # for sales: | 904-239-9564 |
| E-mail address: | lineartradingsys@gmail.com |
Traders' Resource Links | |
| Linear Trading Systems LLC has not added any product or service information to TRADERS' RESOURCE. | |
Click here for more information about our publications!
PRINT THIS ARTICLE

Request Information From Our Sponsors
- StockCharts.com, Inc.
- Candle Patterns
- Candlestick Charting Explained
- Intermarket Technical Analysis
- John Murphy on Chart Analysis
- John Murphy's Chart Pattern Recognition
- John Murphy's Market Message
- MurphyExplainsMarketAnalysis-Intermarket Analysis
- MurphyExplainsMarketAnalysis-Visual Analysis
- StockCharts.com
- Technical Analysis of the Financial Markets
- The Visual Investor
- VectorVest, Inc.
- Executive Premier Workshop
- One-Day Options Course
- OptionsPro
- Retirement Income Workshop
- Sure-Fire Trading Systems (VectorVest, Inc.)
- Trading as a Business Workshop
- VectorVest 7 EOD
- VectorVest 7 RealTime/IntraDay
- VectorVest AutoTester
- VectorVest Educational Services
- VectorVest OnLine
- VectorVest Options Analyzer
- VectorVest ProGraphics v6.0
- VectorVest ProTrader 7
- VectorVest RealTime Derby Tool
- VectorVest Simulator
- VectorVest Variator
- VectorVest Watchdog
