HOT TOPICS LIST
- MACD
- Fibonacci
- RSI
- Gann
- ADXR
- Stochastics
- Volume
- Triangles
- Futures
- Cycles
- Volatility
- ZIGZAG
- MESA
- Retracement
- Aroon
INDICATORS LIST
LIST OF TOPICS
PRINT THIS ARTICLE
by Donald W. Pendergast, Jr.
Having made its low months before the broad market did, it's little wonder that UAL Corp. looks poised to soar in the wake of falling energy prices.
Position: Accumulate
Donald W. Pendergast, Jr.
Donald W. Pendergast is a financial markets consultant who offers specialized services to stock brokers and high net worth individuals who seek a better bottom line for their portfolios.
PRINT THIS ARTICLE
REL. STR COMPARATIVE
UAL Outperforming The XAL And The NYA
11/10/08 10:04:00 AMby Donald W. Pendergast, Jr.
Having made its low months before the broad market did, it's little wonder that UAL Corp. looks poised to soar in the wake of falling energy prices.
Position: Accumulate
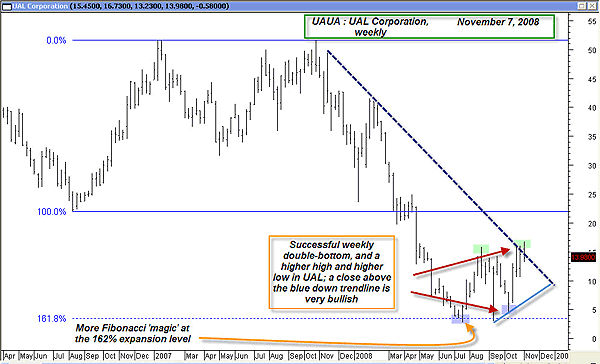
| Today I ran another 13-week relative strength exploration to locate strong stocks in strong industry groups. It turns out that UAL Corp. is one of the best-performing stocks over that period, handily besting both the NYSE Composite and AMEX Airline indexes, respectively, so let's pull up the weekly chart of UAUA, determine what kind of technical evidence exists to support the current rally, and whether this stock can maintain its current flight plan. See Figure 1. |

|
| FIGURE 1: UAL, WEEKLY. A double bottom is followed by a higher high and higher low. |
| Graphic provided by: MetaStock. |
| |
| UAL stock price peaked in late October 2007, reaching $51.60 just as the Dow Jones Industrial Average (DJIA) achieved another all-time high. Price plummeted rapidly afterward, eventually dropping as low as $2.80 by mid-July 2008, a 95% plunge in less than 10 months! However, once crude oil peaked and then reversed in July 2008, UAUA gradually found solid footing upon which to build a base. After successfully testing the $2.80 low in September and then again in October, UAUA also confirmed its weekly uptrend by printing a higher high and a higher low, even as it attempts to finally break the long-term down trendline that lies just above the current price. Adding more confirmation that a major low is in place, the Fibonacci 162% expansion level also acted as a powerful support barrier, a picture-perfect example of the magic of Fibonacci ratios at work. (Do Fib numbers work because of an inherent market DNA that unconsciously orders prices to stop and reverse at certain levels, or are they simply another example of self-fulfilling prophecies at work? That's a topic for another day, but it does provide food for thought.) |

|
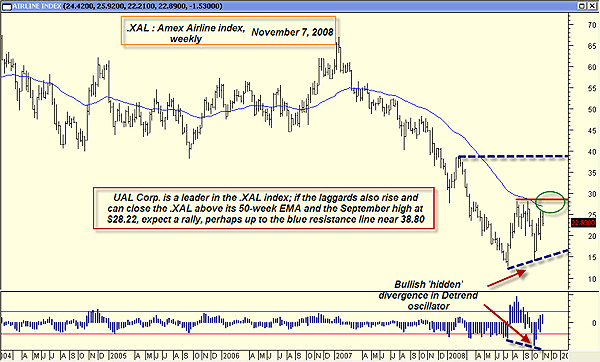
| FIGURE 2: XAL, WEEKLY. The AMEX Airline Index nears key resistance after making a major low. |
| Graphic provided by: MetaStock. |
| Graphic provided by: WB Detrend EOD from Profit Trader for MetaStock. |
| |
| Swapping our focus over to the weekly AMEX Airline index (Figure 2), we're also presented with a fairly bullish scenario; UAL Corp. is currently outperforming the rest of its peers in this index, and if the entire group can manage a close above the 50-week exponential moving average (EMA) and then the September high of $28.22, all systems will be a go for all components in this index. The bullish hidden divergence manifested by the relationship of price to the detrend oscillator is also intriguing, and it also seems to have confirmed itself as price has risen. A higher high hasn't yet been printed, but if and when it does, that's an added confirmation that higher prices may be in store. |

|
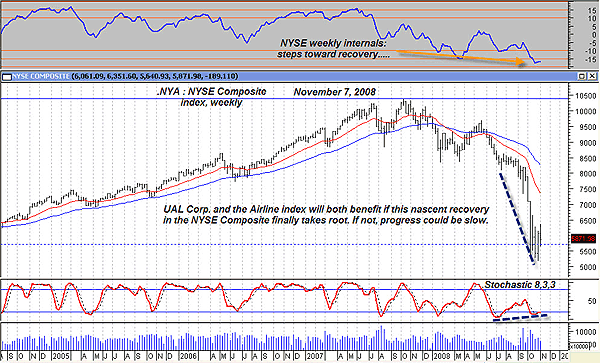
| FIGURE 3: NYA, WEEKLY. Signs of life on the NYSE Composite. |
| Graphic provided by: MetaStock. |
| |
| Finally, a look at the weekly NYSE Composite Index (Figure 3). Deeply wounded over the past year, the NYSE Composite's weekly chart shows some very favorable developments. The internal health of the market (see top gray panel on the chart) is inching higher, even after a bullish price-momentum divergence has printed. Any move higher in the NYA will make it much easier for the stocks in the AMEX Airline index to move up, and, conversely, any additional falls in the broad market indexes will hinder upward momentum in UAL Corp. and the rest of its airborne brethren. So the lesson is simple — trade in the direction of broad market strength and momentum, whenever possible, regardless of the stocks you trade! |
| The worst market plunges end eventually, as evidenced by the price action of UAL Corp. and the AMEX Airline Index. By learning how to confirm the start of a new uptrend in an outperforming stock and/or industry group and by also confirming the strength and momentum of the major indexes, you can learn to place your trades on the right side of the market, a place where the probabilities of success are always in a thoughtful trader's favor. |
Donald W. Pendergast is a financial markets consultant who offers specialized services to stock brokers and high net worth individuals who seek a better bottom line for their portfolios.
| Title: | Writer, market consultant |
| Company: | Linear Trading Systems LLC |
| Jacksonville, FL 32217 | |
| Phone # for sales: | 904-239-9564 |
| E-mail address: | lineartradingsys@gmail.com |
Traders' Resource Links | |
| Linear Trading Systems LLC has not added any product or service information to TRADERS' RESOURCE. | |
Click here for more information about our publications!
Comments
Date: 11/11/08Rank: 4Comment:
Date: 11/11/08Rank: 5Comment:

Request Information From Our Sponsors
- StockCharts.com, Inc.
- Candle Patterns
- Candlestick Charting Explained
- Intermarket Technical Analysis
- John Murphy on Chart Analysis
- John Murphy's Chart Pattern Recognition
- John Murphy's Market Message
- MurphyExplainsMarketAnalysis-Intermarket Analysis
- MurphyExplainsMarketAnalysis-Visual Analysis
- StockCharts.com
- Technical Analysis of the Financial Markets
- The Visual Investor
- VectorVest, Inc.
- Executive Premier Workshop
- One-Day Options Course
- OptionsPro
- Retirement Income Workshop
- Sure-Fire Trading Systems (VectorVest, Inc.)
- Trading as a Business Workshop
- VectorVest 7 EOD
- VectorVest 7 RealTime/IntraDay
- VectorVest AutoTester
- VectorVest Educational Services
- VectorVest OnLine
- VectorVest Options Analyzer
- VectorVest ProGraphics v6.0
- VectorVest ProTrader 7
- VectorVest RealTime Derby Tool
- VectorVest Simulator
- VectorVest Variator
- VectorVest Watchdog
