HOT TOPICS LIST
- MACD
- Fibonacci
- RSI
- Gann
- ADXR
- Stochastics
- Volume
- Triangles
- Futures
- Cycles
- Volatility
- ZIGZAG
- MESA
- Retracement
- Aroon
INDICATORS LIST
LIST OF TOPICS
PRINT THIS ARTICLE
by David Penn
With the April rally gone (but not forgotten), will the June correction mark the beginning of the end of the year-long decline?
Position: N/A
David Penn
Technical Writer for Technical Analysis of STOCKS & COMMODITIES magazine, Working-Money.com, and Traders.com Advantage.
PRINT THIS ARTICLE
TECHNICAL ANALYSIS
The Itsy Bitsy SPDRs and the Year-long Decline
07/02/01 03:08:23 PMby David Penn
With the April rally gone (but not forgotten), will the June correction mark the beginning of the end of the year-long decline?
Position: N/A
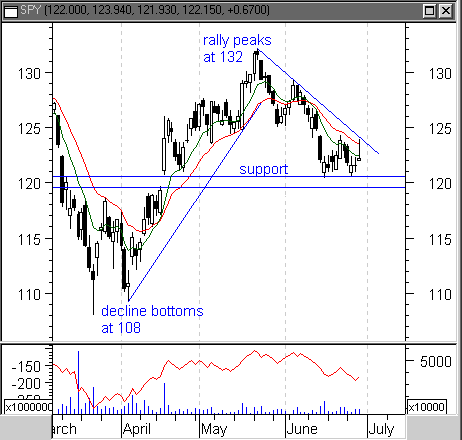
| As the the nursery rhyme goes, it is the rain that comes and washes the spiders from the waterspout. In the markets, a poor earnings outlook and dim prospects of a second half recovery may be what dooms the S&P 500 from building on a 22% advance from mid-March to mid-April. Since that climb, which retraced a whopping 77% of the post-January correction, the S&P 500 (as measured by the depository receipts, the SPDRs) has lost 7%, spending much of June in a range between 121 and 124 (again, using the SPDRs). |
| The SPDRs are holding at a support area just above 120. This support area is characterized by the gap up on April 18th, right in the middle of the spring rally, and by the repeated support tests in late April and mid- to late June. While these tests are not especially vigorous, the combination of the successful tests (at least up until now) and the gap, makes the 120 level an important one for the SPDRs. |

|
| Figure 1: A weak rally toward the moving averages suggests near-term declines for the S&P. |
| Graphic provided by: MetaStock. |
| |
| Take note also of the downtrend line beginning with the May high and connecting the peak in early June with the current price action. Current prices are testing this downtrend line, but the trading session on Thursday, June 28th was not nearly bullish enough. The candlestick representing trading on June 28th shows a bullish finish, but also a dramatic inability of the bulls to sustain their charge, as stocks closed both closer to the open and nearer to the low of the day. |
| The SPDRs have also dropped back beneath an 18-day exponential moving average (EMA) as of early June. A shorter 9-day EMA also plotted against the SPDRs suggests that prices are deteriorating at a faster rate (i.e., the 9-day EMA is leading the 18-day EMA downward). Some whipsawing near the end of 2000 notwithstanding, this combination of moving averages has confirmed both the post-January decline and the spring rally. |
| There's been some question as to whether any near-term decline in the S&P 500 would test the YTD lows reached on March 22nd. A successful retest of these lows would, in the minds (and hopes and dreams) of many, represent the market bottom everyone has been waiting for. However, there is significant congestions between 118 and 113 -- bracketed largely by the sell-off day on March 16th and the relatively smaller volume buy day on April 18 -- that could slow the SPDRs fall. Such an outcome could result in the "Adam and Eve" bottom in which a larger, more severe low (Adam) is tested by a comparable, but less steep low (Eve) with a significant (bear market) rally in between. Should such an "Adam and Eve" bottom develop, the itsy bitsy SPDRs may resume their climb up the waterspout again. |
Technical Writer for Technical Analysis of STOCKS & COMMODITIES magazine, Working-Money.com, and Traders.com Advantage.
| Title: | Technical Writer |
| Company: | Technical Analysis, Inc. |
| Address: | 4757 California Avenue SW |
| Seattle, WA 98116 | |
| Phone # for sales: | 206 938 0570 |
| Fax: | 206 938 1307 |
| Website: | www.Traders.com |
| E-mail address: | DPenn@traders.com |
Traders' Resource Links | |
| Charting the Stock Market: The Wyckoff Method -- Books | |
| Working-Money.com -- Online Trading Services | |
| Traders.com Advantage -- Online Trading Services | |
| Technical Analysis of Stocks & Commodities -- Publications and Newsletters | |
| Working Money, at Working-Money.com -- Publications and Newsletters | |
| Traders.com Advantage -- Publications and Newsletters | |
| Professional Traders Starter Kit -- Software | |
Click here for more information about our publications!
Comments
Date: 07/03/01Rank: 5Comment: Well presented graph and analysis. Everything was understandable.
Date: 07/08/01Rank: 4Comment: In this otherwise good article, for clarity, SPDRs symbol (SPY)and EMA s 9 18 (green red)should have been mentioned in the text or labels.

|

Request Information From Our Sponsors
- VectorVest, Inc.
- Executive Premier Workshop
- One-Day Options Course
- OptionsPro
- Retirement Income Workshop
- Sure-Fire Trading Systems (VectorVest, Inc.)
- Trading as a Business Workshop
- VectorVest 7 EOD
- VectorVest 7 RealTime/IntraDay
- VectorVest AutoTester
- VectorVest Educational Services
- VectorVest OnLine
- VectorVest Options Analyzer
- VectorVest ProGraphics v6.0
- VectorVest ProTrader 7
- VectorVest RealTime Derby Tool
- VectorVest Simulator
- VectorVest Variator
- VectorVest Watchdog
- StockCharts.com, Inc.
- Candle Patterns
- Candlestick Charting Explained
- Intermarket Technical Analysis
- John Murphy on Chart Analysis
- John Murphy's Chart Pattern Recognition
- John Murphy's Market Message
- MurphyExplainsMarketAnalysis-Intermarket Analysis
- MurphyExplainsMarketAnalysis-Visual Analysis
- StockCharts.com
- Technical Analysis of the Financial Markets
- The Visual Investor
