HOT TOPICS LIST
- MACD
- Fibonacci
- RSI
- Gann
- ADXR
- Stochastics
- Volume
- Triangles
- Futures
- Cycles
- Volatility
- ZIGZAG
- MESA
- Retracement
- Aroon
INDICATORS LIST
LIST OF TOPICS
PRINT THIS ARTICLE
by Donald W. Pendergast, Jr.
It's no surprise that most steel-manufacturing stocks have been bludgeoned, but at least one is holding up better than might be expected.
Position: N/A
Donald W. Pendergast, Jr.
Donald W. Pendergast is a financial markets consultant who offers specialized services to stock brokers and high net worth individuals who seek a better bottom line for their portfolios.
PRINT THIS ARTICLE
REL. STR COMPARATIVE
Is Worthington Industries Stronger Than Steel?
11/07/08 08:56:57 AMby Donald W. Pendergast, Jr.
It's no surprise that most steel-manufacturing stocks have been bludgeoned, but at least one is holding up better than might be expected.
Position: N/A
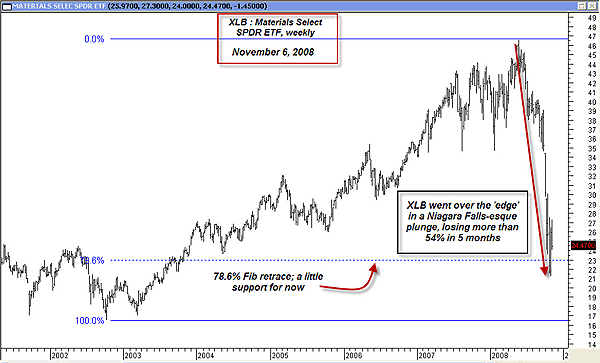
| I ran a relative strength comparison of the nine major market sectors against the Standard & Poor's 500 to find the weakest one over the past 13 weeks, and it was no wonder to see basic materials at the bottom of the list. Off by more than 37% in the past 13 weeks, everything from chemical manufacturers to metals miners to steel producers have been mauled as the global deleveraging caused nearly every type of stock to be marked down to fire-sale prices. However, I was surprised to find several stocks within the basic materials sector have held up better than their parent groups, such as those in the iron and steel industry group. See Figure 1. |

|
| FIGURE 1: MATERIALS SPDR ETF, WEEKLY. XLB is the worst-performing market sector of the past 13 weeks. |
| Graphic provided by: MetaStock. |
| |
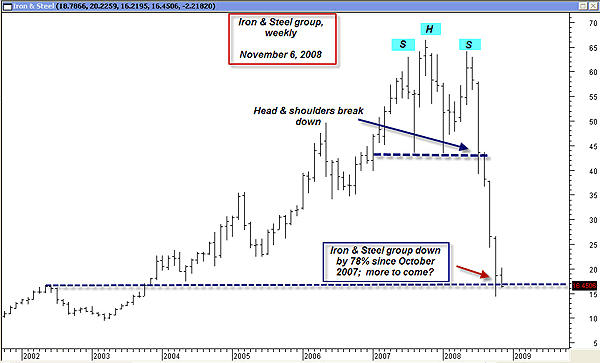
| Drilling down to the worst-performing group within the basic materials sector over the past 13 weeks, my relative strength comparison singled out the iron and steel group (Figure 2). Off by more than 59% in 13 weeks, this group is still struggling to find solid footing, and the charts look very unforgiving. However, buried within this very sick group are two steel producers that seem to have weathered the decline a little better than their competitors have. |

|
| FIGURE 2: IRON & STEEL, WEEKLY. The iron and steel industry group lost nearly 80% in 12 months. |
| Graphic provided by: MetaStock. |
| |
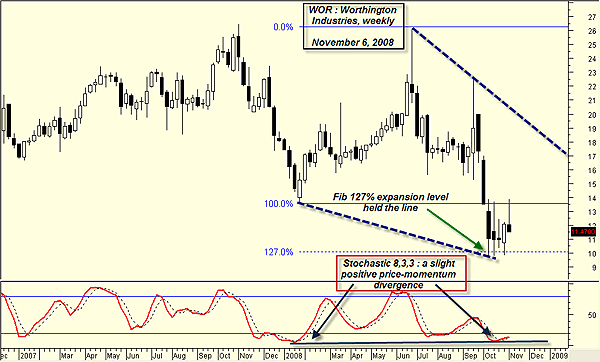
| Worthington Industries (WOR) (Figure 3) and Nucor (NUE) are two of those stocks. While they've both taken a hit along with the rest of the broad market, on a relative strength basis, each one is outperforming their parent industry group, iron and steel. Worthington is only down 35% while Nucor is only off 38% within the past 13 weeks, which is much better than iron and steel, which has endured a major 59% haircut. While neither stock is a buy right now, wise traders and investors will keep an eye on these two, especially once the iron and steel industry group make their final (and as yet, unknown) lows. |

|
| FIGURE 3: WOR, WEEKLY. WOR held up much better than its parent industry group, iron and steel. |
| Graphic provided by: MetaStock. |
| |
| Why would a trader or investor want to search for the best-performing stocks (on a relative basis) within the worst-performing group within the worst-performing market sector anyway? Well, think about the logic of this for a moment. At some point the iron and steel group will make a final low and begin to consolidate before attempting to recover from its recent losses. Wouldn't it make sense to go long the stocks within that group that held up the best during the selloff? Further, there seems to be some evidence to support the claim that the worst-performing groups and sectors of one market cycle frequently become top performers in subsequent market cycles. Relative strength analysis can help identify those sectors and the groups and stocks within; it's a must-have market analysis tool for every serious technician, trader, and investor. |
Donald W. Pendergast is a financial markets consultant who offers specialized services to stock brokers and high net worth individuals who seek a better bottom line for their portfolios.
| Title: | Writer, market consultant |
| Company: | Linear Trading Systems LLC |
| Jacksonville, FL 32217 | |
| Phone # for sales: | 904-239-9564 |
| E-mail address: | lineartradingsys@gmail.com |
Traders' Resource Links | |
| Linear Trading Systems LLC has not added any product or service information to TRADERS' RESOURCE. | |
Click here for more information about our publications!
PRINT THIS ARTICLE

Request Information From Our Sponsors
- VectorVest, Inc.
- Executive Premier Workshop
- One-Day Options Course
- OptionsPro
- Retirement Income Workshop
- Sure-Fire Trading Systems (VectorVest, Inc.)
- Trading as a Business Workshop
- VectorVest 7 EOD
- VectorVest 7 RealTime/IntraDay
- VectorVest AutoTester
- VectorVest Educational Services
- VectorVest OnLine
- VectorVest Options Analyzer
- VectorVest ProGraphics v6.0
- VectorVest ProTrader 7
- VectorVest RealTime Derby Tool
- VectorVest Simulator
- VectorVest Variator
- VectorVest Watchdog
- StockCharts.com, Inc.
- Candle Patterns
- Candlestick Charting Explained
- Intermarket Technical Analysis
- John Murphy on Chart Analysis
- John Murphy's Chart Pattern Recognition
- John Murphy's Market Message
- MurphyExplainsMarketAnalysis-Intermarket Analysis
- MurphyExplainsMarketAnalysis-Visual Analysis
- StockCharts.com
- Technical Analysis of the Financial Markets
- The Visual Investor
