HOT TOPICS LIST
- MACD
- Fibonacci
- RSI
- Gann
- ADXR
- Stochastics
- Volume
- Triangles
- Futures
- Cycles
- Volatility
- ZIGZAG
- MESA
- Retracement
- Aroon
INDICATORS LIST
LIST OF TOPICS
PRINT THIS ARTICLE
by Chaitali Mohile
Immucor began the rally on stronger notes offering good buying opportunities for traders. The resistance on the bullish path can lead to consolidation.
Position: N/A
Chaitali Mohile
Active trader in the Indian stock markets since 2003 and a full-time writer. Trading is largely based upon technical analysis.
PRINT THIS ARTICLE
CONSOLID FORMATION
Immucor Under Resistance
11/05/08 11:25:37 AMby Chaitali Mohile
Immucor began the rally on stronger notes offering good buying opportunities for traders. The resistance on the bullish path can lead to consolidation.
Position: N/A
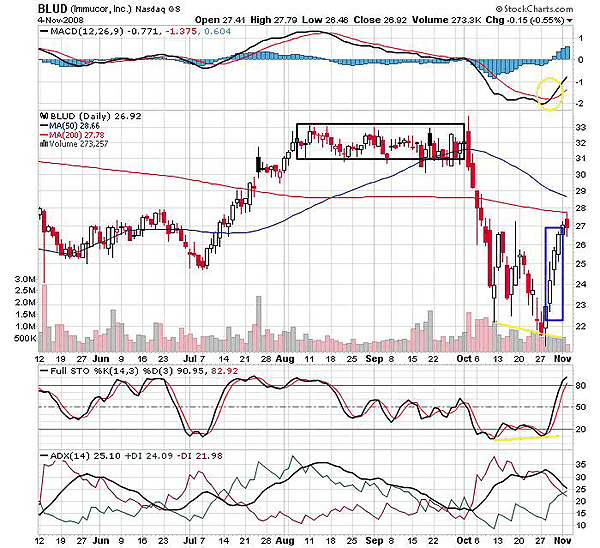
| After an extended rally from 25 to 31 levels, Immucor, Inc. (BLUD) consolidated in August and September 2008. During the consolidation, the moving average convergence/divergence (MACD) (12,26,9) and the full stochastic (14,3,3) formed lower tops, indicating a bearish divergence. The average directional movement index (ADX) (14) moved in favor of the bears as well. The consolidation thus broke against the direction of an existing uptrend. The stock took a nosedive to 22, losing 10 points from the top. Later, BLUD consolidated at the lower level, and the stochastic (14,3,3) formed a double bottom (see Figure 1), indicating the bullish reversal possibility. The MACD (12,26,9) has undergone a bullish crossover in negative territory. |
| Accordingly, BLUD surged from the bottom on positive signals. During an upward move, the stock formed a three white soldiers bullish candlestick pattern. The three white soldiers is a bullish reversal pattern, with each candle opening within the body of the previous candle. It is also important that every candle should close at or near the high of the day to make a valid formation. BLUD moved higher after this bullish reversal pattern, indicating strong buying force. The ADX (14) is indicating the declining downtrend, and the buying pressure is likely to improve. But the rally has hit a 200-day moving average resistance, suppressing the current bullish force. |

|
| FIGURE 1: BLUD, DAILY. The bullish rally has reached the 200-day MA resistance. |
| Graphic provided by: StockCharts.com. |
| |
| Under the resistance, the rally may cool off but the stock may not retrace to the lower pivot. When the positive directional index (+DI) and the negative directional index (-DI) of the ADX (14) move closer or get tangled, they indicate consolidation. In Figure 1, the ADX (14) is indicating consolidation in the declining downtrend. In addition, the overbought stochastic (14,3,3) can either move horizontally or surge to higher levels in the bullish region. Since BLUD may consolidate under resistance, I would recommend that traders book profits. Let's look at the weekly chart now to verify the stability of the bullish consolidation. |

|
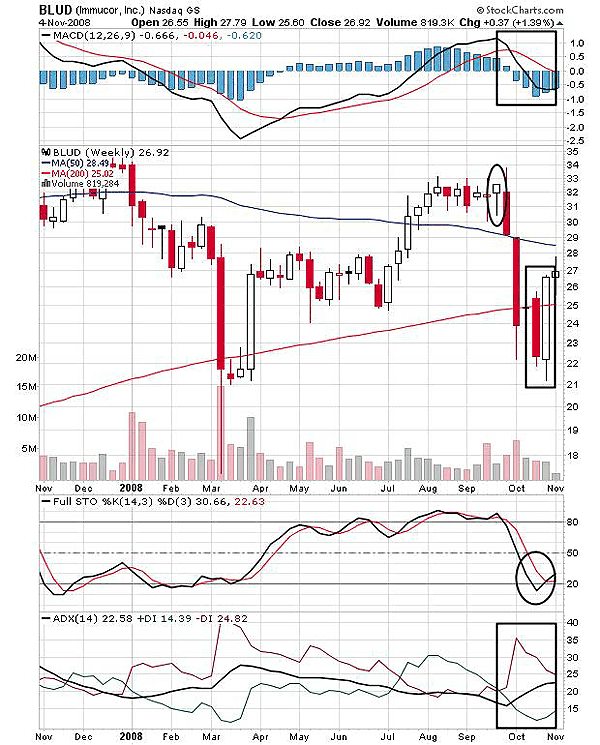
| FIGURE 2: BLUD, WEEKLY. The converging moving averages may result in narrow range price movement. |
| Graphic provided by: StockCharts.com. |
| |
| Figure 2 is equally bullish and encouraging for bullish traders. The price chart shows the bullish engulfing pattern, indicating a breakout rally. The 200-day MA is now strong support, whereas the 50-day MA is the resistance at 29 levels. But both the moving averages in Figure 2 are converging, which can result in narrow range-bound consolidation in the long term. The stochastic (14,3,3) is moving above the oversold level, while the MACD (12,26,9) is ready to move into positive territory. Therefore, both indicators suggest an upside journey and fresh buying opportunity on a weekly basis. The ADX (14), however, is indicating a developing downtrend with declining selling pressure. |
| Therefore, under the resistance of the 200-day MA in Figure 1, BLUD is likely to sustain at the current level of 26-28. The stock may consolidate at these levels, so I would recommend traders book their profits and stay on the sidelines. Trading during consolidation is highly risky, and the volatility prevailing in the financial market across the world is very high, so profit-taking would be wiser. |
Active trader in the Indian stock markets since 2003 and a full-time writer. Trading is largely based upon technical analysis.
| Company: | Independent |
| Address: | C1/3 Parth Indraprasth Towers. Vastrapur |
| Ahmedabad, Guj 380015 | |
| E-mail address: | chaitalimohile@yahoo.co.in |
Traders' Resource Links | |
| Independent has not added any product or service information to TRADERS' RESOURCE. | |
Click here for more information about our publications!
Comments

Request Information From Our Sponsors
- StockCharts.com, Inc.
- Candle Patterns
- Candlestick Charting Explained
- Intermarket Technical Analysis
- John Murphy on Chart Analysis
- John Murphy's Chart Pattern Recognition
- John Murphy's Market Message
- MurphyExplainsMarketAnalysis-Intermarket Analysis
- MurphyExplainsMarketAnalysis-Visual Analysis
- StockCharts.com
- Technical Analysis of the Financial Markets
- The Visual Investor
- VectorVest, Inc.
- Executive Premier Workshop
- One-Day Options Course
- OptionsPro
- Retirement Income Workshop
- Sure-Fire Trading Systems (VectorVest, Inc.)
- Trading as a Business Workshop
- VectorVest 7 EOD
- VectorVest 7 RealTime/IntraDay
- VectorVest AutoTester
- VectorVest Educational Services
- VectorVest OnLine
- VectorVest Options Analyzer
- VectorVest ProGraphics v6.0
- VectorVest ProTrader 7
- VectorVest RealTime Derby Tool
- VectorVest Simulator
- VectorVest Variator
- VectorVest Watchdog
