HOT TOPICS LIST
- MACD
- Fibonacci
- RSI
- Gann
- ADXR
- Stochastics
- Volume
- Triangles
- Futures
- Cycles
- Volatility
- ZIGZAG
- MESA
- Retracement
- Aroon
INDICATORS LIST
LIST OF TOPICS
PRINT THIS ARTICLE
by Chaitali Mohile
The S&P 600 Small Cap Index has reached the target on a head & shoulders top reversal pattern. After the prolonged fall, the index shows bullish signs for the rally.
Position: Buy
Chaitali Mohile
Active trader in the Indian stock markets since 2003 and a full-time writer. Trading is largely based upon technical analysis.
PRINT THIS ARTICLE
CHART ANALYSIS
The S&P 600 Small Cap Index Hits Target
11/04/08 09:07:37 AMby Chaitali Mohile
The S&P 600 Small Cap Index has reached the target on a head & shoulders top reversal pattern. After the prolonged fall, the index shows bullish signs for the rally.
Position: Buy
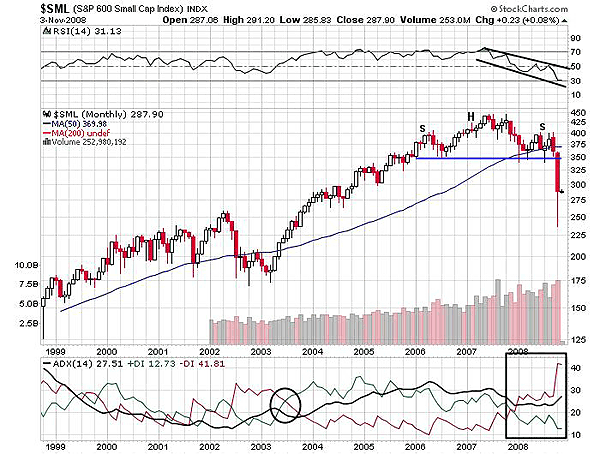
| The S&P 600 Small Cap Index ($SML) formed a head & shoulders top reversal pattern on the monthly chart (Figure 1). The left shoulder was formed in 2006, and the pattern was completed in September 2008. The breakdown target, below the neckline support at 350 levels, was achieved by the end of October. Here, the potential target on the head & shoulders top reversal is calculated by measuring the distance between the highest peak and neckline support, and then subtracting this distance from the breakdown level. Therefore, 350 (breakdown level) - 100 (450-350) = 250. We can see in Figure 1 that $SML moved below 250 (target) in October and rushed back to close at higher levels. |

|
| FIGURE 1: $SML, MONTHLY. The target on the head & shoulders top reversal pattern is achieved. The long lower shadow of the candle indicates that the index has closed much higher after hitting the target at 250. |
| Graphic provided by: StockCharts.com. |
| |
| The relative strength index (RSI) (14) gradually moved to bearish levels at 30 from the overbought area. The indicator is not oversold, but if the support is established at 30 levels, the fresh bullish strength may get generated. In addition, $SML has hit the target on the reversal pattern, so a minor relief rally can be anticipated. However, the long-term trend indicated by the average directional movement index (ADX) (14) is bearish. During a downtrend, an index or equity can undergo small rallies. |
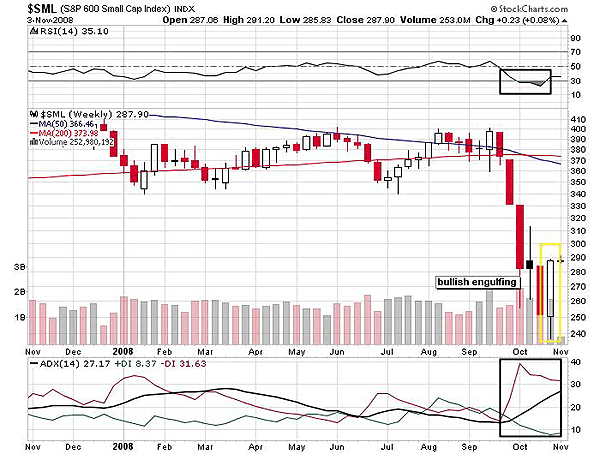
| The weekly chart (Figure 2) would help to reconfirm the bullish rally in the near future. In Figure 2, the 200-day moving average (MA) was strong support for $SML. After the breakdown below the 200-day MA, the index entered a fresh downtrend with robust selling pressure. The index plunged to 260 levels, and thereafter, the descending move slowed down. The recently formed bullish candle with a low at 240 levels has completely covered the previous bearish candle forming a bullish engulfing pattern. This pattern suggests the beginning of a fresh upside rally. The encouraging volume would add strength to the future rally. The relative strength index (RSI)(14) is also ready to surge from oversold territory. Hence, fresh long trades can be initiated with a short-term view. |

|
| FIGURE 2: $SML, WEEKLY. The bullish engulfing candlestick pattern suggest an upcoming bullish rally. The oversold RSI(14) also support the rally, indicating the possibility of fresh trading opportunity. |
| Graphic provided by: StockCharts.com. |
| |
| The negative directional index (-DI) of ADX (14) indicates lessening selling pressure, though the downtrend is developing. This descending selling pressure would definitely energize buyers to carry the bullish rally higher. The relief rally across the globe would give a boost to traders and make the upward move in $SML successful. |
| Thus, both charts suggest a temporary pullback for the S&P 600 Small Cap Index. |
Active trader in the Indian stock markets since 2003 and a full-time writer. Trading is largely based upon technical analysis.
| Company: | Independent |
| Address: | C1/3 Parth Indraprasth Towers. Vastrapur |
| Ahmedabad, Guj 380015 | |
| E-mail address: | chaitalimohile@yahoo.co.in |
Traders' Resource Links | |
| Independent has not added any product or service information to TRADERS' RESOURCE. | |
Click here for more information about our publications!
PRINT THIS ARTICLE

Request Information From Our Sponsors
- StockCharts.com, Inc.
- Candle Patterns
- Candlestick Charting Explained
- Intermarket Technical Analysis
- John Murphy on Chart Analysis
- John Murphy's Chart Pattern Recognition
- John Murphy's Market Message
- MurphyExplainsMarketAnalysis-Intermarket Analysis
- MurphyExplainsMarketAnalysis-Visual Analysis
- StockCharts.com
- Technical Analysis of the Financial Markets
- The Visual Investor
- VectorVest, Inc.
- Executive Premier Workshop
- One-Day Options Course
- OptionsPro
- Retirement Income Workshop
- Sure-Fire Trading Systems (VectorVest, Inc.)
- Trading as a Business Workshop
- VectorVest 7 EOD
- VectorVest 7 RealTime/IntraDay
- VectorVest AutoTester
- VectorVest Educational Services
- VectorVest OnLine
- VectorVest Options Analyzer
- VectorVest ProGraphics v6.0
- VectorVest ProTrader 7
- VectorVest RealTime Derby Tool
- VectorVest Simulator
- VectorVest Variator
- VectorVest Watchdog
