HOT TOPICS LIST
- MACD
- Fibonacci
- RSI
- Gann
- ADXR
- Stochastics
- Volume
- Triangles
- Futures
- Cycles
- Volatility
- ZIGZAG
- MESA
- Retracement
- Aroon
INDICATORS LIST
LIST OF TOPICS
PRINT THIS ARTICLE
by Donald W. Pendergast, Jr.
Like every other broad market index, the NYSE Composite has taken a severe beating. However, signs of life on both the daily and weekly time frames suggest that a significant low has been made.
Position: Accumulate
Donald W. Pendergast, Jr.
Donald W. Pendergast is a financial markets consultant who offers specialized services to stock brokers and high net worth individuals who seek a better bottom line for their portfolios.
PRINT THIS ARTICLE
ULTIMATE OSCILLATOR
The NYSE Composite Has Bullish Divergences In Two Time Frames
11/04/08 08:44:00 AMby Donald W. Pendergast, Jr.
Like every other broad market index, the NYSE Composite has taken a severe beating. However, signs of life on both the daily and weekly time frames suggest that a significant low has been made.
Position: Accumulate
| Think of the NYSE Composite index (.NYA) as a gigantic version of the more commonly tracked Standard & Poor's 500. It covers many more stocks, and even though it closely correlates to movements in the S&P 500, for my money, the .NYA provides a better overall view of the broad US market. The view lately, of course, has been anything but picturesque as the fabled index hurtled southward. Having bottomed out for the moment, however, thoughtful analysis suggests that the .NYA has entered into a period of consolidation that may eventually wash a good deal of the fear factor out of the markets. The charts, as always, tell the tale best. |

|
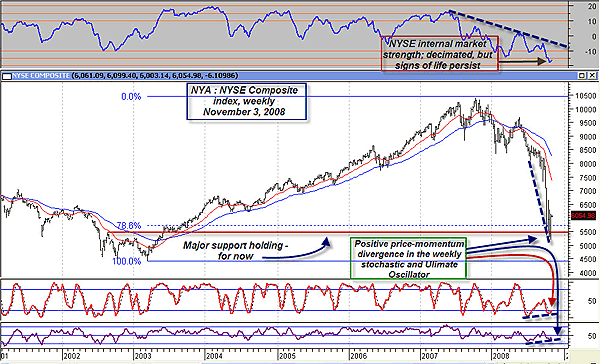
| FIGURE 1: NYA, WEEKLY. Major support on the .NYA, holding for now. |
| Graphic provided by: MetaStock. |
| |
| The weekly chart of the .NYA (Figure 1) provides graphic evidence of the severity of the selloffs since last autumn. At the top of the chart is the composite internal strength indicator, which is a weighted mix of the advance-decline line, new highs-new lows, up volume-down volume, rate of change, and a few other oddities, the sum of which provides an excellent view of the market's overall health. Having bottomed at an all-time low a couple of weeks ago, it's now attempting to turn higher. Other evidence suggesting a low may be in place: there is positive price-momentum divergence on the weekly stochastic and the ultimate oscillator. Finally, the 78.6% Fibonacci retracement and the major long-term support line (red horizontal line) have combined to keep a solid floor under the .NYA, effectively putting an end to the freefall that began in July 2008. |

|
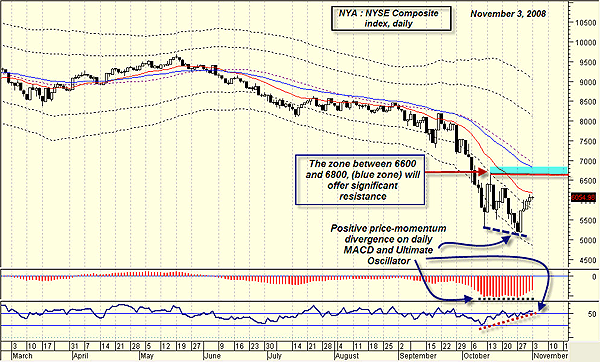
| FIGURE 2: NYA, DAILY. Bullish price-momentum divergence on the daily NYSE Composite. |
| Graphic provided by: MetaStock. |
| |
| The daily chart of the .NYA (Figure 2) also demonstrates signs of meaningful positive price-momentum divergences in both the moving average convergence/divergence (MACD) and the ultimate oscillator. If a higher low prints, followed by a break above the most recent (to be determined) high, the uptrend will be confirmed. Should that happen, expect the blue zone between 6600–6800 to offer major overhead resistance, particularly because of the confluence of key Fibonacci resistance levels, the October 14th high and the location of the mighty 50-period exponential moving average (EMA). |
| The "hard right edge" of the charts give us a few extra clues every day, but the bulk of of a technical analyst's evidence for likely trend projections can only be found in the complex relationship between price, proportion, pattern, and time, using monthly, weekly, and daily charts to confirm what trader Jesse Livermore referred to as the line of least resistance. From my perspective, the line of least resistance on the .NYA, for the time being, is higher. But not radically higher, because this bear market isn't over by a long shot. |
Donald W. Pendergast is a financial markets consultant who offers specialized services to stock brokers and high net worth individuals who seek a better bottom line for their portfolios.
| Title: | Writer, market consultant |
| Company: | Linear Trading Systems LLC |
| Jacksonville, FL 32217 | |
| Phone # for sales: | 904-239-9564 |
| E-mail address: | lineartradingsys@gmail.com |
Traders' Resource Links | |
| Linear Trading Systems LLC has not added any product or service information to TRADERS' RESOURCE. | |
Click here for more information about our publications!
Comments
Date: 11/04/08Rank: 5Comment:

Request Information From Our Sponsors
- VectorVest, Inc.
- Executive Premier Workshop
- One-Day Options Course
- OptionsPro
- Retirement Income Workshop
- Sure-Fire Trading Systems (VectorVest, Inc.)
- Trading as a Business Workshop
- VectorVest 7 EOD
- VectorVest 7 RealTime/IntraDay
- VectorVest AutoTester
- VectorVest Educational Services
- VectorVest OnLine
- VectorVest Options Analyzer
- VectorVest ProGraphics v6.0
- VectorVest ProTrader 7
- VectorVest RealTime Derby Tool
- VectorVest Simulator
- VectorVest Variator
- VectorVest Watchdog
- StockCharts.com, Inc.
- Candle Patterns
- Candlestick Charting Explained
- Intermarket Technical Analysis
- John Murphy on Chart Analysis
- John Murphy's Chart Pattern Recognition
- John Murphy's Market Message
- MurphyExplainsMarketAnalysis-Intermarket Analysis
- MurphyExplainsMarketAnalysis-Visual Analysis
- StockCharts.com
- Technical Analysis of the Financial Markets
- The Visual Investor
