HOT TOPICS LIST
- MACD
- Fibonacci
- RSI
- Gann
- ADXR
- Stochastics
- Volume
- Triangles
- Futures
- Cycles
- Volatility
- ZIGZAG
- MESA
- Retracement
- Aroon
INDICATORS LIST
LIST OF TOPICS
PRINT THIS ARTICLE
by James Kupfer
Shares of solar energy stocks have been on a run recently. Is it time to buy?
Position: Sell
James Kupfer
Mr. Kupfer is a market professional and amateur stock market commentator. Disclosure: It is likely that Mr. Kupfer has or will enter a position in any security he writes about.
PRINT THIS ARTICLE
LINEAR REG CHANNEL
Solar Energy Looking Dim
11/03/08 09:41:11 AMby James Kupfer
Shares of solar energy stocks have been on a run recently. Is it time to buy?
Position: Sell
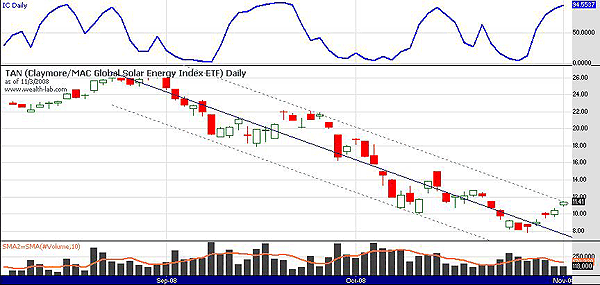
| Many solar energy stocks such as First Solar, LDK Solar, and Evergreen Solar once had high-flying stock prices that have now come down closer to Earth. In the last few days in particular, many of these solar energy stocks have risen 40–80%. As I write this the morning of November 3, 2008, shares of the Claymore/MAC Global Solar Index exchange traded fund (ETF) (TAN) are currently up over 10%. So is now a time to buy, or are these shares ready for a pullback? |
| Looking at the chart of TAN (Figure 1), you can see that the stock has formed a downward-sloping linear regression channel. TAN has risen to the very top of the channel boundary. If it is to stay within the channel, it must turn down again soon. |

|
| FIGURE 1: TAN, DAILY. Note the downward-sloping linear regression channel. |
| Graphic provided by: Wealth-lab. |
| |
| There are a few other things worth noticing in addition to the channel boundaries. First, the daily stochastics are very overbought. As can be seen, stochastics has done a good job in identifying overbought and oversold regions. Second, note that each time the ETF has decreased in price, it has done so on decreasing volume. The times it has dropped have been on increasing volume. This indicates that sellers are in control. Over the last five days when the stock has risen over 40%, it has done so on decreasing volume as well. |
| While TAN has had a very strong move in the last few days, the evidence indicates that solar stocks in general are currently overbought and should shortly resume their downward trajectory. If we were to short the ETF here around $11.60, a good potential stop price would be north of $13, where the ETF had its last minor peak. The price target for a TAN short would be well below $8. |
Mr. Kupfer is a market professional and amateur stock market commentator. Disclosure: It is likely that Mr. Kupfer has or will enter a position in any security he writes about.
Click here for more information about our publications!
PRINT THIS ARTICLE

Request Information From Our Sponsors
- StockCharts.com, Inc.
- Candle Patterns
- Candlestick Charting Explained
- Intermarket Technical Analysis
- John Murphy on Chart Analysis
- John Murphy's Chart Pattern Recognition
- John Murphy's Market Message
- MurphyExplainsMarketAnalysis-Intermarket Analysis
- MurphyExplainsMarketAnalysis-Visual Analysis
- StockCharts.com
- Technical Analysis of the Financial Markets
- The Visual Investor
- VectorVest, Inc.
- Executive Premier Workshop
- One-Day Options Course
- OptionsPro
- Retirement Income Workshop
- Sure-Fire Trading Systems (VectorVest, Inc.)
- Trading as a Business Workshop
- VectorVest 7 EOD
- VectorVest 7 RealTime/IntraDay
- VectorVest AutoTester
- VectorVest Educational Services
- VectorVest OnLine
- VectorVest Options Analyzer
- VectorVest ProGraphics v6.0
- VectorVest ProTrader 7
- VectorVest RealTime Derby Tool
- VectorVest Simulator
- VectorVest Variator
- VectorVest Watchdog
