HOT TOPICS LIST
- MACD
- Fibonacci
- RSI
- Gann
- ADXR
- Stochastics
- Volume
- Triangles
- Futures
- Cycles
- Volatility
- ZIGZAG
- MESA
- Retracement
- Aroon
INDICATORS LIST
LIST OF TOPICS
PRINT THIS ARTICLE
by Donald W. Pendergast, Jr.
The Australian dollar appears to be successfully testing important support levels now and may be in position to recover as the US dollar falters.
Position: Accumulate
Donald W. Pendergast, Jr.
Donald W. Pendergast is a financial markets consultant who offers specialized services to stock brokers and high net worth individuals who seek a better bottom line for their portfolios.
PRINT THIS ARTICLE
FIBONACCI
Australian Dollar -- Support Test In Progress
11/03/08 09:31:38 AMby Donald W. Pendergast, Jr.
The Australian dollar appears to be successfully testing important support levels now and may be in position to recover as the US dollar falters.
Position: Accumulate
| Currencies, commodities, equities, you name it ... it doesn't matter; everything was dumped along with the bath water during the global financial market rout of the past four months. The Aussie dollar was no exception, having shed as much as 30% against the US dollar early last week. However, the currency is now testing and/or approaching major support levels on both the monthly and the weekly charts (Figures 1 and 2). These are important support levels, and currency traders will be watching closely. |

|
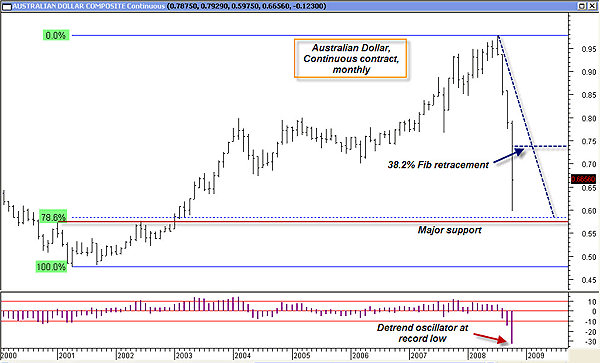
| FIGURE 1: AUSSIE, MONTHLY. A successful retest of 0.6000 — will it happen? |
| Graphic provided by: MetaStock. |
| |
| The monthly chart shows how vicious the decline has been, smashing right through three significant support levels established during 2006—08 (Figure 1). This past week, the price dropped below 0.6000, nearly hitting the "maximum retracement" Fibonacci level of 0.786 before rebounding sharply to close at 0.6656. If the 0.5800–0.6000 level holds on a retest, we may witness one of two different scenarios develop: 1) A "V" bottom, which could mean a powerful short-covering rally, or 2) A long, drawn-out A-B-C corrective pattern, with this month's low as point A. Given the outrageously negative reading on the monthly detrend oscillator (more than twice as oversold as it was during the August 1998 global financial crisis), the first scenario, a "V" bottom, might actually have a better than even chance of occurring, but only time will tell. |

|
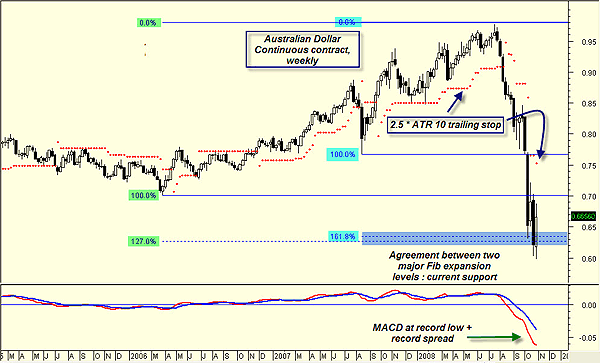
| FIGURE 2: AUSSIE, WEEKLY. Two distinct Fibonacci levels — telling the truth about support? |
| Graphic provided by: MetaStock. |
| |
| The Aussie's weekly chart (Figure 2) also features a Fibonacci theme, one that actually confirms the major support evidence on the monthly chart. When two separate Fibonacci grids agree (in this case, a 127% and 161% expansion ratio agree on a support level), the support level is considered to be more significant. It appears to be so in this case, as price rebounded sharply after a brief test of the sub-0.6000 zone. Also of note, the moving average convergence/divergence (MACD) is at its most negative reading ever, with the spread between the signal line and the indicator also in record territory. The red dots on the chart are the 2.5 * ATR 10 trailing volatility stop. If and when price can close above that level on the weekly chart, the odds are that the downtrend is over and a period of consolidation may be due. |
| The long-term fundamentals for Australia and its currency appear to be sound, especially in relation to the United States and the US dollar. Australia's plentiful supply of natural gas, uranium, copper, and wheat, combined with its relatively close proximity to growing Chinese and Asian markets, all seem to suggest that the Australian dollar will be an in-demand currency for some time. However, long-term outlooks don't always jive with the "right-now" action on the charts. In the meantime, the Aussie's price action near major support levels should be interesting to watch. |
Donald W. Pendergast is a financial markets consultant who offers specialized services to stock brokers and high net worth individuals who seek a better bottom line for their portfolios.
| Title: | Writer, market consultant |
| Company: | Linear Trading Systems LLC |
| Jacksonville, FL 32217 | |
| Phone # for sales: | 904-239-9564 |
| E-mail address: | lineartradingsys@gmail.com |
Traders' Resource Links | |
| Linear Trading Systems LLC has not added any product or service information to TRADERS' RESOURCE. | |
Click here for more information about our publications!
PRINT THIS ARTICLE

Request Information From Our Sponsors
- StockCharts.com, Inc.
- Candle Patterns
- Candlestick Charting Explained
- Intermarket Technical Analysis
- John Murphy on Chart Analysis
- John Murphy's Chart Pattern Recognition
- John Murphy's Market Message
- MurphyExplainsMarketAnalysis-Intermarket Analysis
- MurphyExplainsMarketAnalysis-Visual Analysis
- StockCharts.com
- Technical Analysis of the Financial Markets
- The Visual Investor
- VectorVest, Inc.
- Executive Premier Workshop
- One-Day Options Course
- OptionsPro
- Retirement Income Workshop
- Sure-Fire Trading Systems (VectorVest, Inc.)
- Trading as a Business Workshop
- VectorVest 7 EOD
- VectorVest 7 RealTime/IntraDay
- VectorVest AutoTester
- VectorVest Educational Services
- VectorVest OnLine
- VectorVest Options Analyzer
- VectorVest ProGraphics v6.0
- VectorVest ProTrader 7
- VectorVest RealTime Derby Tool
- VectorVest Simulator
- VectorVest Variator
- VectorVest Watchdog
