

HOT TOPICS LIST
- MACD
- Fibonacci
- RSI
- Gann
- ADXR
- Stochastics
- Volume
- Triangles
- Futures
- Cycles
- Volatility
- ZIGZAG
- MESA
- Retracement
- Aroon
INDICATORS LIST
LIST OF TOPICS
PRINT THIS ARTICLE
by Alan R. Northam
In a previous article entitled "Is The Oil Uptrend Over?" published on 07/23/08, I wrote that oil could fall to as low as $53 per barrel. Today, I am reporting that oil has fallen to a low of $50.44 and a low in oil could be in place.
Position: N/A
Alan R. Northam
Alan Northam lives in the Dallas, Texas area and as an electronic engineer gave him an analytical mind from which he has developed a thorough knowledge of stock market technical analysis. His abilities to analyze the future direction of the stock market has allowed him to successfully trade of his own portfolio over the last 30 years. Mr. Northam is now retired and trading the stock market full time. You can reach him at inquiry@tradersclassroom.com or by visiting his website at http://www.tradersclassroom.com. You can also follow him on Twitter @TradersClassrm.
PRINT THIS ARTICLE
ELLIOTT WAVE
Oil Hits Bottom
10/31/08 11:38:43 AMby Alan R. Northam
In a previous article entitled "Is The Oil Uptrend Over?" published on 07/23/08, I wrote that oil could fall to as low as $53 per barrel. Today, I am reporting that oil has fallen to a low of $50.44 and a low in oil could be in place.
Position: N/A
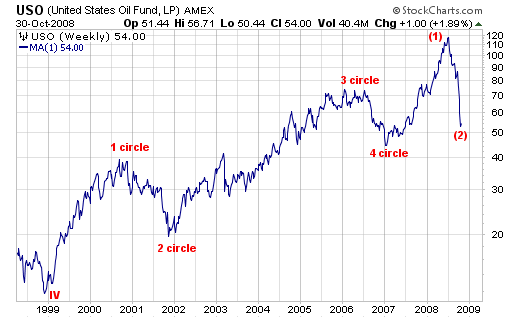
| Figure 1 shows a weekly closing price chart of the United States Oil Fund (USO) since 1999. This chart shows the long-term upward trend in oil. This chart also shows my updated Elliott wave count. This chart shows that wave IV was completed in 1999 and wave V is currently in progress. This chart also shows that a wave 5 circle is now under way and is subdividing into five waves. Once these subwaves are complete, that will also complete a wave 5 circle and a wave V. The importance of this chart is to show that oil has further to go on the upside before another meaningful correction will occur and will most likely take several years to complete. This analysis does not bode well for the economy going forward and shows that we must find alternatives to the use of oil. |
|
| FIGURE 1: USO, WEEKLY. This chart shows that the long-term upward trend in oil is still in progress. |
| Graphic provided by: StockCharts.com. |
| |
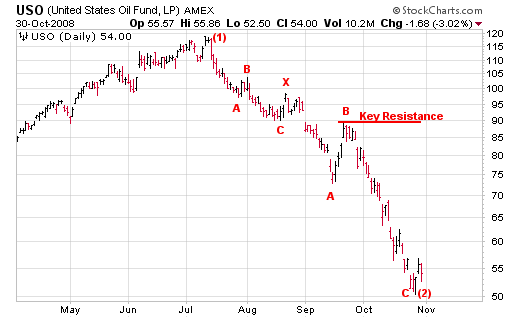
| Figure 2 shows the Elliott wave analysis of corrective wave (2) that started in July and now looks to be complete. Figure 2 shows that the market correction unfolded as a double ABC zigzag connected together by an X wave. Double ABC zigzag corrections happen occasionally. However, in more rare cases, a market correction can morph into even more complex corrective patterns. Since these cases are rare, there is a high probability that the market correction is now over. To confirm that the correction is over, I have shown a red horizontal resistance level drawn from the high price of wave B and labeled as "key resistance." Should USO close above this price level, then that will be a high-probability signal that the market correction is over and the upward trend has resumed. |
|
| FIGURE 2: USO, DAILY. This chart shows the Elliott wave count of the latest market correction. This figure shows that USO has now completed a double ABC zigzag corrective structure and key resistance level. |
| Graphic provided by: StockCharts.com. |
| |
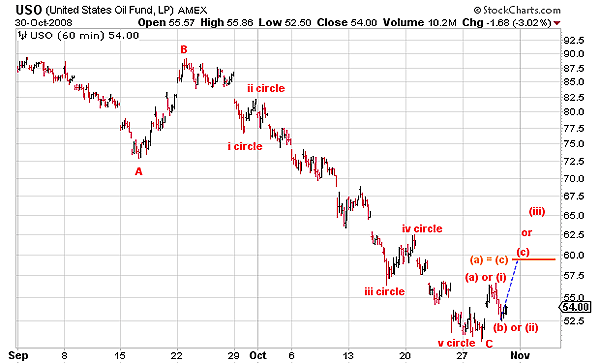
| As further evidence that the market correction in oil is over, see the 60-minute chart in Figure 3. This chart shows the final wave C of the market correction. I have shown that wave C has unfolded in five subwaves, wave i circle, ii circle, iii circle, iv circle, and v circle. According to Elliott wave theory, wave Cs unfold in five waves and so my analysis agrees with the Elliott wave theory. Following the completion of wave C down, the market has now started to trend upward. It is still too early to determine the structure of the upward trend, so I have shown it as two possibilities. The market could be unfolding as a more complex market correction, so I have shown that the market could be forming an abc zigzag. If USO is going to form a more complex corrective wave structure, then this market should turn back down where wave (c) is equal to wave (a). However, if this market continues higher, then there is a high probability that a five-wave move up is under way. According to Elliott, five waves define the direction of the next larger trend, which would be up. |
|
| FIGURE 3: USO, HOURLY. This chart shows the detail of the final wave C of the ABC zigzag market correction. This chart also shows that the upward trend is now starting to resume. |
| Graphic provided by: StockCharts.com. |
| |
| In conclusion, it looks like oil has completed its market correction and resumed its upward trend. A close above key resistance is necessary to confirm the continuation of the upward trend. However, if the market turns back down at around $60 per barrel, then there exists a high probability that the market correction is not yet over. Either way, oil is either at a market low now or will be at a market low with one more downward leg, after which the next leg of the upward trend in oil will be under way. |
Alan Northam lives in the Dallas, Texas area and as an electronic engineer gave him an analytical mind from which he has developed a thorough knowledge of stock market technical analysis. His abilities to analyze the future direction of the stock market has allowed him to successfully trade of his own portfolio over the last 30 years. Mr. Northam is now retired and trading the stock market full time. You can reach him at inquiry@tradersclassroom.com or by visiting his website at http://www.tradersclassroom.com. You can also follow him on Twitter @TradersClassrm.
| Garland, Tx | |
| Website: | www.tradersclassroom.com |
| E-mail address: | inquiry@tradersclassroom.com |
Click here for more information about our publications!
Comments
Date:�11/02/08Rank:�5Comment:�

Request Information From Our Sponsors
- StockCharts.com, Inc.
- Candle Patterns
- Candlestick Charting Explained
- Intermarket Technical Analysis
- John Murphy on Chart Analysis
- John Murphy's Chart Pattern Recognition
- John Murphy's Market Message
- MurphyExplainsMarketAnalysis-Intermarket Analysis
- MurphyExplainsMarketAnalysis-Visual Analysis
- StockCharts.com
- Technical Analysis of the Financial Markets
- The Visual Investor
- VectorVest, Inc.
- Executive Premier Workshop
- One-Day Options Course
- OptionsPro
- Retirement Income Workshop
- Sure-Fire Trading Systems (VectorVest, Inc.)
- Trading as a Business Workshop
- VectorVest 7 EOD
- VectorVest 7 RealTime/IntraDay
- VectorVest AutoTester
- VectorVest Educational Services
- VectorVest OnLine
- VectorVest Options Analyzer
- VectorVest ProGraphics v6.0
- VectorVest ProTrader 7
- VectorVest RealTime Derby Tool
- VectorVest Simulator
- VectorVest Variator
- VectorVest Watchdog