HOT TOPICS LIST
- MACD
- Fibonacci
- RSI
- Gann
- ADXR
- Stochastics
- Volume
- Triangles
- Futures
- Cycles
- Volatility
- ZIGZAG
- MESA
- Retracement
- Aroon
INDICATORS LIST
LIST OF TOPICS
PRINT THIS ARTICLE
by Chaitali Mohile
Southern Co. has been in a healthy uptrend for more than five years. The bearish formations suggest a trend reversal.
Position: Sell
Chaitali Mohile
Active trader in the Indian stock markets since 2003 and a full-time writer. Trading is largely based upon technical analysis.
PRINT THIS ARTICLE
CANDLESTICK CHARTING
Southern Co. Forms Bearish Reversals
10/31/08 11:27:30 AMby Chaitali Mohile
Southern Co. has been in a healthy uptrend for more than five years. The bearish formations suggest a trend reversal.
Position: Sell
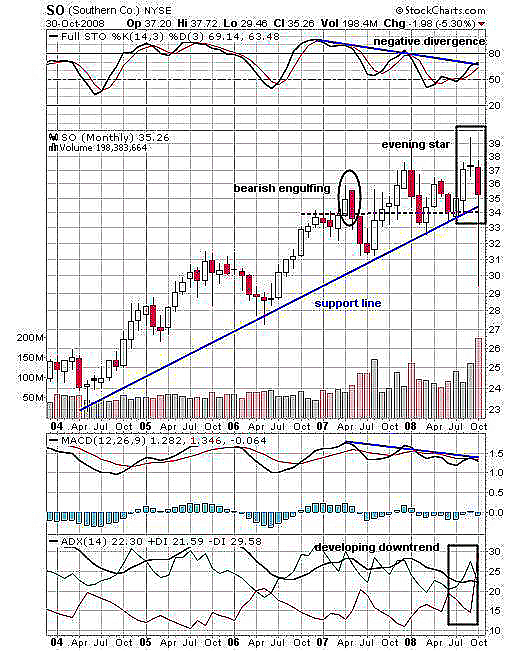
| Southern Co. (SO) made an all-time high when the global financial markets were in a major crisis. The stock has been rallying higher for almost five years, and the ascending trendline shows bullish strength and support levels as well. But the picture is likely to reverse soon, due to the bearish formation on the monthly chart (Figure 1). |
| The bearish engulfing reversal candlestick pattern was the first strong bearish signal since 2004. Thereafter, the volatility increased, and as a result, SO slipped to a previous low from the top. The full stochastic (14,3,3) showed negative divergence toward the price rally. This indicates an upcoming weakness that can result in a descending run. In addition, the moving average convergence/divergence (MACD) (12,26,9) also formed lower peaks while SO was undergoing a bullish rally. Therefore, the negative divergence on two momentum indicators can slow down the accelerated bullish speed. |

|
| FIGURE 1: SO, MONTHLY. The evening star and the negative divergence in stochastics (14,3,3) and MACD (12,26,9) are major trend reversal indications. |
| Graphic provided by: StockCharts.com. |
| |
| In Figure 1, traders can see another reversal candlestick pattern of an evening star. The evening star is a formation of three candlesticks -- the first bullish candle, the middle candle is a doji with a small real body, and the third is bearish. The first candle indicates the current bullish trend, the doji indicates uncertainty and indecisions, resulting in negative sentiments reflected in the third bearish candle. The three candles together are working toward the uptrend. |
| In Figure 1, traders can note that the doji formed a new high of 37.20. The third bearish candle with a long lower shadow indicates the pullback rally from the lower level of 29. SO has closed above the support-resistance trendline drawn in Figure 1. But the negativity is high, as the selling pressure indicated by negative directional index (-DI) of the trend indicator has increased. Therefore, the average directional movement index (ADX) (14) indicates a developing downtrend. |
| Hence, the big picture suggests that the huge bearish rally is under way for SO. |
Active trader in the Indian stock markets since 2003 and a full-time writer. Trading is largely based upon technical analysis.
| Company: | Independent |
| Address: | C1/3 Parth Indraprasth Towers. Vastrapur |
| Ahmedabad, Guj 380015 | |
| E-mail address: | chaitalimohile@yahoo.co.in |
Traders' Resource Links | |
| Independent has not added any product or service information to TRADERS' RESOURCE. | |
Click here for more information about our publications!
PRINT THIS ARTICLE

Request Information From Our Sponsors
- VectorVest, Inc.
- Executive Premier Workshop
- One-Day Options Course
- OptionsPro
- Retirement Income Workshop
- Sure-Fire Trading Systems (VectorVest, Inc.)
- Trading as a Business Workshop
- VectorVest 7 EOD
- VectorVest 7 RealTime/IntraDay
- VectorVest AutoTester
- VectorVest Educational Services
- VectorVest OnLine
- VectorVest Options Analyzer
- VectorVest ProGraphics v6.0
- VectorVest ProTrader 7
- VectorVest RealTime Derby Tool
- VectorVest Simulator
- VectorVest Variator
- VectorVest Watchdog
- StockCharts.com, Inc.
- Candle Patterns
- Candlestick Charting Explained
- Intermarket Technical Analysis
- John Murphy on Chart Analysis
- John Murphy's Chart Pattern Recognition
- John Murphy's Market Message
- MurphyExplainsMarketAnalysis-Intermarket Analysis
- MurphyExplainsMarketAnalysis-Visual Analysis
- StockCharts.com
- Technical Analysis of the Financial Markets
- The Visual Investor
