HOT TOPICS LIST
- MACD
- Fibonacci
- RSI
- Gann
- ADXR
- Stochastics
- Volume
- Triangles
- Futures
- Cycles
- Volatility
- ZIGZAG
- MESA
- Retracement
- Aroon
INDICATORS LIST
LIST OF TOPICS
PRINT THIS ARTICLE
by Donald W. Pendergast, Jr.
The price action in copper since July 2008 has been horrific, but an important support test may be in the offing.
Position: Accumulate
Donald W. Pendergast, Jr.
Donald W. Pendergast is a financial markets consultant who offers specialized services to stock brokers and high net worth individuals who seek a better bottom line for their portfolios.
PRINT THIS ARTICLE
SUPPORT & RESISTANCE
Copper Approaches Major Support Test
10/31/08 09:19:37 AMby Donald W. Pendergast, Jr.
The price action in copper since July 2008 has been horrific, but an important support test may be in the offing.
Position: Accumulate
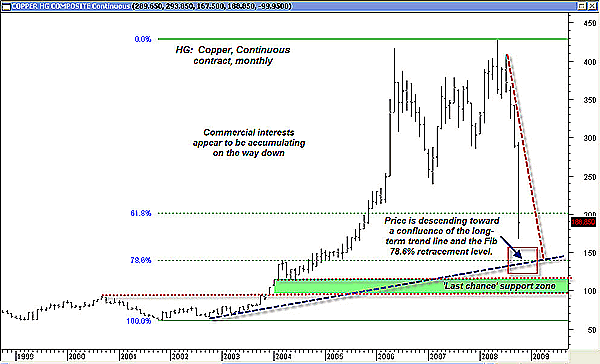
| Look at a commodity chart, almost any commodity chart, and you'll see the same devastating down moves, moves that wiped out months and/or years of solid gains. Copper was hit especially hard; not only did the global "deleveraging" bug bite copper in the neck, but the fears of an imminent global recession also helped drive prices down with extra zeal. A 60% plunge in less than six months is no minor accomplishment, and it might take copper several years before it even begins to approach the record highs set in 2006 and 2008, respectively. |

|
| FIGURE 1: COPPER, MONTHLY. Heading for the "box" — will there be a bounce? |
| Graphic provided by: MetaStock. |
| |
| The monthly copper chart seen in Figure 1 depicts the vicious downdraft in especially stark detail. Even the downtrend line from last summer's high is nearly vertical, suggesting that the bull run in this metal has been seriously sidetracked. However, every action results in an opposing reaction to some extent, and if copper successfully tests the Fibonacci 76.8% support and/or the long-term trendline, a sharp short-covering rally could ensue. There also exists two other significant support barriers between $118 and $100, but if they are actually hit, the copper bull will be mortally wounded, and the rest of the basic metals group (nickel, lead, zinc, and so on) will also likely be derailed. Interestingly, the most recent Commitment of Traders data suggests that commercial interests seem to view this metal as an accumulation opportunity. |

|
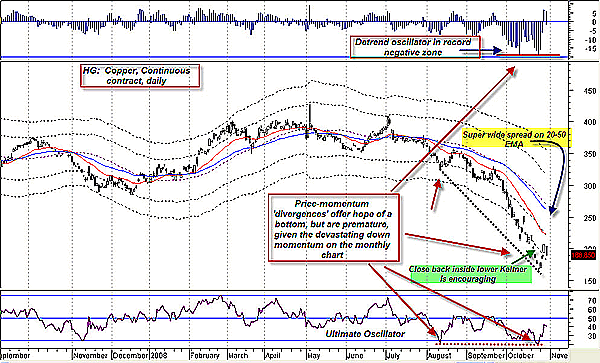
| FIGURE 2: COPPER, DAILY. Copper's daily price-momentum divergences look suspect. |
| Graphic provided by: MetaStock. |
| |
| Drilling down to the daily chart (Figure 2), it appears that the tiniest evidence (the close back inside the lower Keltner band) of a minor reversal has appeared but as of now it remains suspect, given the heavy downside momentum on the monthly chart. Even the price-momentum divergences on the detrend and ultimate oscillators look "iffy," mostly because of the equality of the indicator readings themselves, despite the divergent price action on the chart. The wide spread on the 20–50 exponential moving averages (EMAs) is interesting, as ultrawide spreads generally appear near the start of reversals and/or consolidations. |
| Copper, an essential component in modern industrial societies, is definitely under pressure, but given that an important support level is within striking distance, there could be some spectacular fireworks near those price zones. |
Donald W. Pendergast is a financial markets consultant who offers specialized services to stock brokers and high net worth individuals who seek a better bottom line for their portfolios.
| Title: | Writer, market consultant |
| Company: | Linear Trading Systems LLC |
| Jacksonville, FL 32217 | |
| Phone # for sales: | 904-239-9564 |
| E-mail address: | lineartradingsys@gmail.com |
Traders' Resource Links | |
| Linear Trading Systems LLC has not added any product or service information to TRADERS' RESOURCE. | |
Click here for more information about our publications!
Comments
Date: 11/02/08Rank: 5Comment:

Request Information From Our Sponsors
- VectorVest, Inc.
- Executive Premier Workshop
- One-Day Options Course
- OptionsPro
- Retirement Income Workshop
- Sure-Fire Trading Systems (VectorVest, Inc.)
- Trading as a Business Workshop
- VectorVest 7 EOD
- VectorVest 7 RealTime/IntraDay
- VectorVest AutoTester
- VectorVest Educational Services
- VectorVest OnLine
- VectorVest Options Analyzer
- VectorVest ProGraphics v6.0
- VectorVest ProTrader 7
- VectorVest RealTime Derby Tool
- VectorVest Simulator
- VectorVest Variator
- VectorVest Watchdog
- StockCharts.com, Inc.
- Candle Patterns
- Candlestick Charting Explained
- Intermarket Technical Analysis
- John Murphy on Chart Analysis
- John Murphy's Chart Pattern Recognition
- John Murphy's Market Message
- MurphyExplainsMarketAnalysis-Intermarket Analysis
- MurphyExplainsMarketAnalysis-Visual Analysis
- StockCharts.com
- Technical Analysis of the Financial Markets
- The Visual Investor
