

HOT TOPICS LIST
- MACD
- Fibonacci
- RSI
- Gann
- ADXR
- Stochastics
- Volume
- Triangles
- Futures
- Cycles
- Volatility
- ZIGZAG
- MESA
- Retracement
- Aroon
INDICATORS LIST
LIST OF TOPICS
PRINT THIS ARTICLE
by James Kupfer
Fibonacci retracement levels can help target how much of a bounce we may get in the Dow Jones 30.
Position: Hold
James Kupfer
Mr. Kupfer is a market professional and amateur stock market commentator. Disclosure: It is likely that Mr. Kupfer has or will enter a position in any security he writes about.
PRINT THIS ARTICLE
FIBONACCI
How Far Up?
10/30/08 08:56:12 AMby James Kupfer
Fibonacci retracement levels can help target how much of a bounce we may get in the Dow Jones 30.
Position: Hold
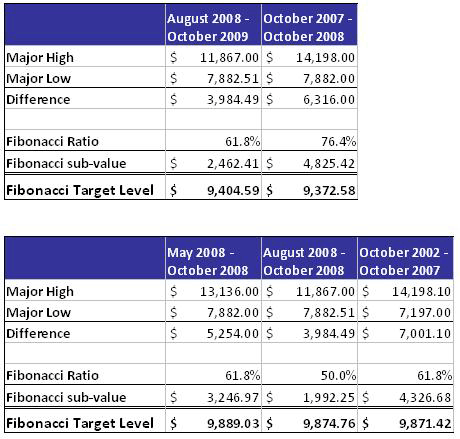
| Assuming the low of October 10, 2008, at 7882 marked a short-term bottom in the Dow Jones 30, where might we be headed from here? Of course, that can be a difficult question to answer, but Fibonacci retracement levels can indicate where likely reversal points lie. In particular, I find it useful to look for "clusters" of Fibonacci levels to help identify these key support or resistance points. |
| In identifying the key Fibonacci levels, I look for major turning points on weekly charts. In Figure 1 are two spreadsheets in which I have calculated a number of major turning points and their respective cluster of Fibonacci retracement levels. |
|
| FIGURE 1: FIBONACCI TURNING POINTS. There are a number of major turning points and their respective cluster of Fibonacci retracement levels. |
| Graphic provided by: Excel. |
| |
| As you can see, the two primary clusters above where the DJ30 is currently trading are approximately around 9400 and 9880. Given the close on October 28, 2008, at 9065, there is still some upside potential left in the market. It is likely that the DJ30 will surpass the initial resistance level at 9400, given that the market reached as high as 9794 on October 14, just four days after what at this point appears to be a short-term bottom. Therefore, the 9870–9880 level is the next real target. |
| As a bounce (hopefully) materializes, it will be important to watch the price action to see how things progress. Assuming the market makes it near the 9880 level, there are a few other non-Fibonacci indicators of resistance that may come into play that can be identified later. The bottom line, however, is that any bounce that may occur is doing so in a bear market and should generally be considered an opportunity to reestablish short positions. Only a move above 10,500 would be cause to doubt the ongoing existence of the bear. |
Mr. Kupfer is a market professional and amateur stock market commentator. Disclosure: It is likely that Mr. Kupfer has or will enter a position in any security he writes about.
Click here for more information about our publications!
PRINT THIS ARTICLE

Request Information From Our Sponsors
- StockCharts.com, Inc.
- Candle Patterns
- Candlestick Charting Explained
- Intermarket Technical Analysis
- John Murphy on Chart Analysis
- John Murphy's Chart Pattern Recognition
- John Murphy's Market Message
- MurphyExplainsMarketAnalysis-Intermarket Analysis
- MurphyExplainsMarketAnalysis-Visual Analysis
- StockCharts.com
- Technical Analysis of the Financial Markets
- The Visual Investor
- VectorVest, Inc.
- Executive Premier Workshop
- One-Day Options Course
- OptionsPro
- Retirement Income Workshop
- Sure-Fire Trading Systems (VectorVest, Inc.)
- Trading as a Business Workshop
- VectorVest 7 EOD
- VectorVest 7 RealTime/IntraDay
- VectorVest AutoTester
- VectorVest Educational Services
- VectorVest OnLine
- VectorVest Options Analyzer
- VectorVest ProGraphics v6.0
- VectorVest ProTrader 7
- VectorVest RealTime Derby Tool
- VectorVest Simulator
- VectorVest Variator
- VectorVest Watchdog