HOT TOPICS LIST
- MACD
- Fibonacci
- RSI
- Gann
- ADXR
- Stochastics
- Volume
- Triangles
- Futures
- Cycles
- Volatility
- ZIGZAG
- MESA
- Retracement
- Aroon
INDICATORS LIST
LIST OF TOPICS
PRINT THIS ARTICLE
by Donald W. Pendergast, Jr.
After a 62% plunge since the May high, the Market Vectors Nuclear Energy ETF appears to have formed a double bottom on its daily chart.
Position: Accumulate
Donald W. Pendergast, Jr.
Donald W. Pendergast is a financial markets consultant who offers specialized services to stock brokers and high net worth individuals who seek a better bottom line for their portfolios.
PRINT THIS ARTICLE
DETREND PRICE OSCILL
A Double Bottom Pattern For Market Vectors Nuclear Energy ETF
10/30/08 08:48:22 AMby Donald W. Pendergast, Jr.
After a 62% plunge since the May high, the Market Vectors Nuclear Energy ETF appears to have formed a double bottom on its daily chart.
Position: Accumulate
| The nuclear energy industry has been revitalized in recent years. As the price of crude oil and concerns about global climate change have begun to have a significant impact upon the attitudes and behaviors of individuals and businesses, nuclear energy is back on the table, and hundreds of new power plants are under construction and/or in the planning phase. Wall Street has taken notice, of course, recently launching the Nuclear Energy ETF (NLR). |

|
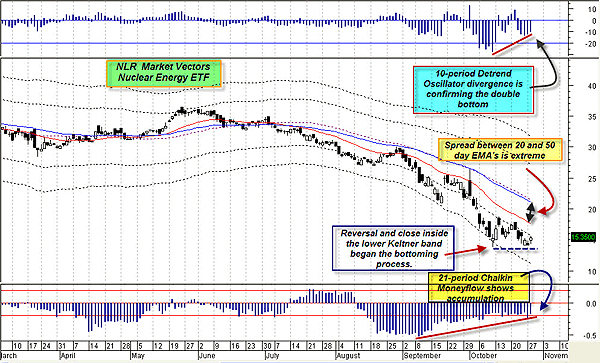
| FIGURE 1: NLR, DAILY. A confluence of indicators and patterns suggest that a double bottom is forming in this ETF. |
| Graphic provided by: MetaStock. |
| Graphic provided by: TechSmith. |
| |
| The daily chart of NLR clearly displays the months-long downtrend, which began to accelerate in May 2008 (Figure 1). On October 10, the price dropped below and then closed inside the lower Keltner band, offering the first evidence that the worst of the selloff may have occurred. Another confirming clue manifested at the same time — the 21-period Chaikin money flow (CMF) was demonstrating a positive divergence, indicating greatly reduced selling pressure. The 10-period detrend oscillator was also at a record low, another tipoff that the selling was overdone for the time being. Moving forward to October 28, the price has, for the moment, completed a successful test of the October 10th low, even as the 21-period CMF and detrend oscillator continue to confirm the early October low. Although it's a lagging indicator, the spread between the 20- and 50-day EMA is also at a record level, and that also provides confirmation that a reversal of some degree may be in process for NLR. |

|
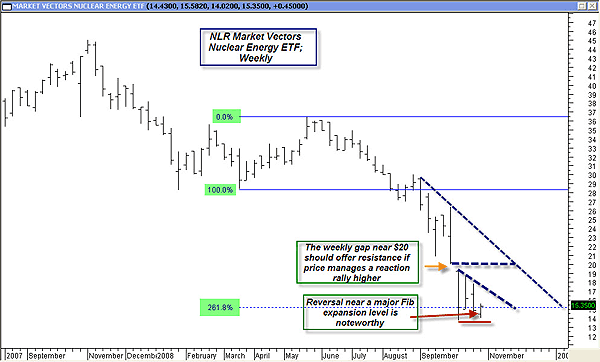
| FIGURE 2: NLP, WEEKLY. A reaction rally will likely meet with stiff resistance. |
| Graphic provided by: MetaStock. |
| Graphic provided by: TechSmith. |
| |
| Looking at the weekly chart of NLR (Figure 2), the severity of the six-month downdraft is more striking than on the daily chart. There is a ton of overhead supply in this equity, so any reaction move higher is likely to meet with significant resistance, especially near the upper end of the gap near $20. On a more positive note, witness the reversal bar near the important Fibonacci 261% expansion level. This, in conjunction with the action on the daily chart and the overall technical state of the broad market, lends credible confirmation that a major low may have printed for NLR. |
| The confluence of price patterns (a double bottom in this case), 21-period CMF, 10-period detrend, Keltner bands, and Fibonacci expansion ratios all contribute to careful, thoughtful analysis of NLR. The weight of this technical evidence appears to confirm that a low is in place, but as always, the market will have the final say. |
Donald W. Pendergast is a financial markets consultant who offers specialized services to stock brokers and high net worth individuals who seek a better bottom line for their portfolios.
| Title: | Writer, market consultant |
| Company: | Linear Trading Systems LLC |
| Jacksonville, FL 32217 | |
| Phone # for sales: | 904-239-9564 |
| E-mail address: | lineartradingsys@gmail.com |
Traders' Resource Links | |
| Linear Trading Systems LLC has not added any product or service information to TRADERS' RESOURCE. | |
Click here for more information about our publications!
Comments
Date: 11/02/08Rank: 4Comment:

|

Request Information From Our Sponsors
- VectorVest, Inc.
- Executive Premier Workshop
- One-Day Options Course
- OptionsPro
- Retirement Income Workshop
- Sure-Fire Trading Systems (VectorVest, Inc.)
- Trading as a Business Workshop
- VectorVest 7 EOD
- VectorVest 7 RealTime/IntraDay
- VectorVest AutoTester
- VectorVest Educational Services
- VectorVest OnLine
- VectorVest Options Analyzer
- VectorVest ProGraphics v6.0
- VectorVest ProTrader 7
- VectorVest RealTime Derby Tool
- VectorVest Simulator
- VectorVest Variator
- VectorVest Watchdog
- StockCharts.com, Inc.
- Candle Patterns
- Candlestick Charting Explained
- Intermarket Technical Analysis
- John Murphy on Chart Analysis
- John Murphy's Chart Pattern Recognition
- John Murphy's Market Message
- MurphyExplainsMarketAnalysis-Intermarket Analysis
- MurphyExplainsMarketAnalysis-Visual Analysis
- StockCharts.com
- Technical Analysis of the Financial Markets
- The Visual Investor
