HOT TOPICS LIST
- MACD
- Fibonacci
- RSI
- Gann
- ADXR
- Stochastics
- Volume
- Triangles
- Futures
- Cycles
- Volatility
- ZIGZAG
- MESA
- Retracement
- Aroon
INDICATORS LIST
LIST OF TOPICS
PRINT THIS ARTICLE
by Ron Walker
The market has had a sinister selloff as investors have become dispirited and depressed. Each time a rally occurs, their hopes of a recovery are quickly dashed as more panicked investors sell into the rally. But the volatility index could be sending us a message that the worst may be behind us.
Position: N/A
Ron Walker
Ron Walker is an active trader and technical analyst. He operates an educational website dedicated to the study of Technical Analysis. The website offers free market analysis with daily video presentations and written commentaries. Ron is a video pioneer, being one of the first to utilize the internet producing Technical Analysis videos. His website is thechartpatterntrader.com
PRINT THIS ARTICLE
VOLATILITY
A Seismic Spike For The VIX
10/29/08 12:23:14 PMby Ron Walker
The market has had a sinister selloff as investors have become dispirited and depressed. Each time a rally occurs, their hopes of a recovery are quickly dashed as more panicked investors sell into the rally. But the volatility index could be sending us a message that the worst may be behind us.
Position: N/A
| Uncertainty and unrest linger over the financial markets right now. In this era of bailouts and writeoffs, there is a tremendous crisis of confidence in the financial world. During uncertain times, the market falls prey to panic, which often sparks anxiety producing irrational selloffs. This current selloff that we are witnessing has been a nightmare. But despite the gloomy outlook that a recession may be on the horizon, some sanity may be returning to the markets. |

|
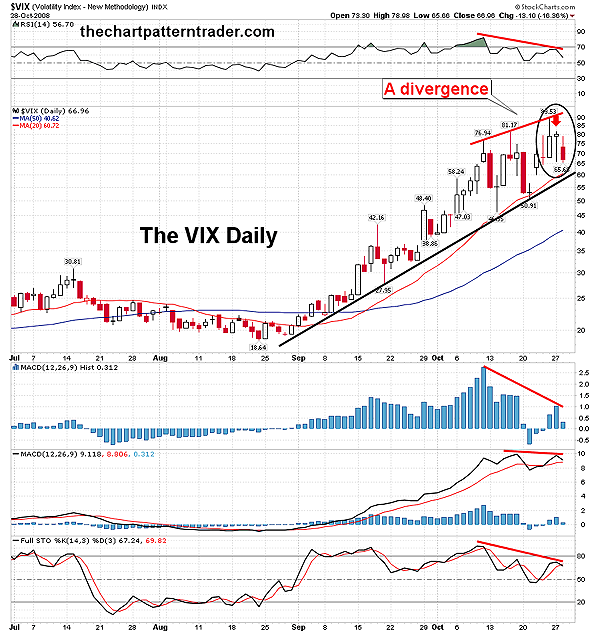
| FIGURE 1: VOLATILITY INDEX, DAILY. Here on the VIX, there is a divergence between the MACD histogram and the price chart. A divergence is also showing on the stochastic and the RSI. Look for the MACD histogram to move below zero and for the MACD line to cross below the signal line. This should decrease volatility. |
| Graphic provided by: StockCharts.com. |
| |
| The volatility index (VIX), which is the gauge of fear, got a seismic spike on its daily chart last Friday on October 24, 2008 (Figure 1). The VIX got an intraday peak of 89.53, which is a record rise for the index, reaffirming that fear has a stranglehold over this market. This spike created a divergence between its price chart and the moving average convergence/divergence (MACD) histogram. The divergence occurred when the MACD histogram formed a lower peak, while the VIX moved higher on the price chart. The MACD histogram put in a lower bar and is now sloping downward. After the divergence appeared, a bearish hanging man candlestick pattern formed during the following session. The hanging man pattern needs a close below the lowest low of the pattern in order to be confirmed. The VIX is now resting just above its intermediate trendline. If the bearish candlestick pattern plays out and the VIX's trendline breaks down, it will dampen the enthusiasm of the bears and produce a shift in momentum to the upside for the stock market. |
| The MACD histogram plots the difference between the MACD line and the signal line. That allows the MACD histogram to give an advance warning of a bullish or bearish cross that is to come on the MACD. The MACD usually follows the histogram's lead. In Figure 2, the MACD histogram has formed a lower peak, but the MACD has not yet completed its divergence with the VIX's price chart. When the histogram bars move below the zero line, the MACD will likely get a bearish crossover at that point. You may have noticed that the same divergence has occurred on the relative strength index (RSI) (14) and the full stochastic (14, 3, 3). |
| If a bearish MACD crossover does occur, penetration of the VIX's intermediate trendline will take place. That will stabilize the market and allow it to put in a tradable bottom as volatility begins to decline. As the VIX implodes, it will usher in an overdue rally, which should continue unabated and unopposed for some time. The VIX is a truth serum of market sentiment, being a contrarian indicator, moving in the opposite direction of the market. When it reaches extreme levels, bottoms form and the market begins to rally. The fear factor that produces the extreme levels on the VIX often finds long-positioned, short-sighted, panic-stricken investors eager to sell their shares as long-term cool-headed investors snatch them up at bargain prices. Fear creates supply, so once everyone who wants to sell has done so, supply dries up as optimism take over and creates demand to push prices higher once again. |

|
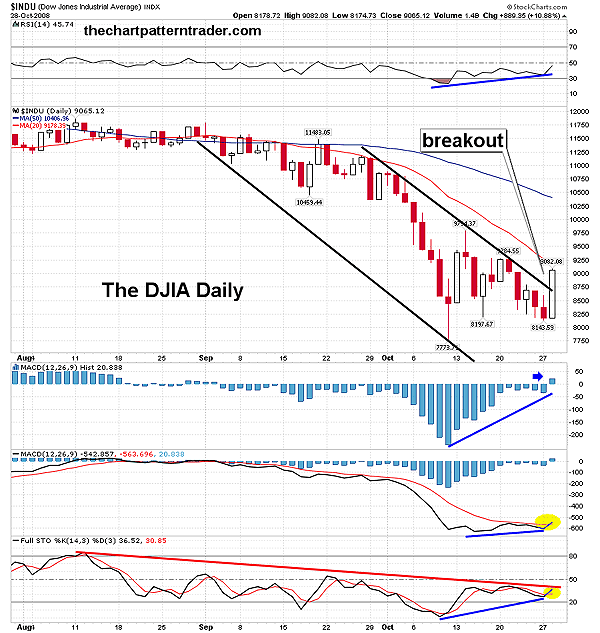
| FIGURE 2: DJIA, DAILY. The DJIA broke out of its downtrend on October 28. That same day, the MACD histogram moved above zero and the MACD got a bullish cross (highlighted in yellow). If the DJIA develops a new rising trend, regaining its momentum, then the VIX should begin to show signs of weakening. The stochastic and the RSI will both eventually move above 50 if the breakout is legitimate. |
| Graphic provided by: StockCharts.com. |
| |
| As I write this on October 28, the Dow Jones Industrial Average (DJIA) put in its second-largest point gain in history, gaining 889 points or 10.88% in one day (Figure 2). That push higher allowed the DJIA to get a bullish cross on its MACD and also broke out of its falling price channel. With the bullish cross of the DJIA's MACD, the chances favor a bearish crossover on the MACD of the VIX. Even though this breathtaking rally on the DJIA has broken the downtrend, it will still likely be underestimated as an inconsequential and frivolous event, due to the amount of pessimism among investors. But the DJIA just bounced off a sea of support and there are powerful undercurrents working within this market that have the potential to allow this rally to thrive. |
Ron Walker is an active trader and technical analyst. He operates an educational website dedicated to the study of Technical Analysis. The website offers free market analysis with daily video presentations and written commentaries. Ron is a video pioneer, being one of the first to utilize the internet producing Technical Analysis videos. His website is thechartpatterntrader.com
| Website: | thechartpatterntrader.com |
| E-mail address: | thechartpatterntrader@gmail.com |
Click here for more information about our publications!
Comments

Request Information From Our Sponsors
- StockCharts.com, Inc.
- Candle Patterns
- Candlestick Charting Explained
- Intermarket Technical Analysis
- John Murphy on Chart Analysis
- John Murphy's Chart Pattern Recognition
- John Murphy's Market Message
- MurphyExplainsMarketAnalysis-Intermarket Analysis
- MurphyExplainsMarketAnalysis-Visual Analysis
- StockCharts.com
- Technical Analysis of the Financial Markets
- The Visual Investor
- VectorVest, Inc.
- Executive Premier Workshop
- One-Day Options Course
- OptionsPro
- Retirement Income Workshop
- Sure-Fire Trading Systems (VectorVest, Inc.)
- Trading as a Business Workshop
- VectorVest 7 EOD
- VectorVest 7 RealTime/IntraDay
- VectorVest AutoTester
- VectorVest Educational Services
- VectorVest OnLine
- VectorVest Options Analyzer
- VectorVest ProGraphics v6.0
- VectorVest ProTrader 7
- VectorVest RealTime Derby Tool
- VectorVest Simulator
- VectorVest Variator
- VectorVest Watchdog
