HOT TOPICS LIST
- MACD
- Fibonacci
- RSI
- Gann
- ADXR
- Stochastics
- Volume
- Triangles
- Futures
- Cycles
- Volatility
- ZIGZAG
- MESA
- Retracement
- Aroon
INDICATORS LIST
LIST OF TOPICS
PRINT THIS ARTICLE
by Arthur Hill
Although Microsoft remains in a clear downtrend, the stock is testing support with a bullish candlestick pattern that could foreshadow an oversold bounce.
Position: Hold
Arthur Hill
Arthur Hill is currently editor of TDTrader.com, a website specializing in trading strategies, sector/industry specific breadth stats and overall technical analysis. He passed the Society of Technical Analysts (STA London) diploma exam with distinction is a Certified Financial Technician (CFTe). Prior to TD Trader, he was the Chief Technical Analyst for Stockcharts.com and the main contributor to the ChartSchool.
PRINT THIS ARTICLE
CANDLESTICK CHARTING
MSFT Tests Support With A Harami
10/29/08 08:37:33 AMby Arthur Hill
Although Microsoft remains in a clear downtrend, the stock is testing support with a bullish candlestick pattern that could foreshadow an oversold bounce.
Position: Hold
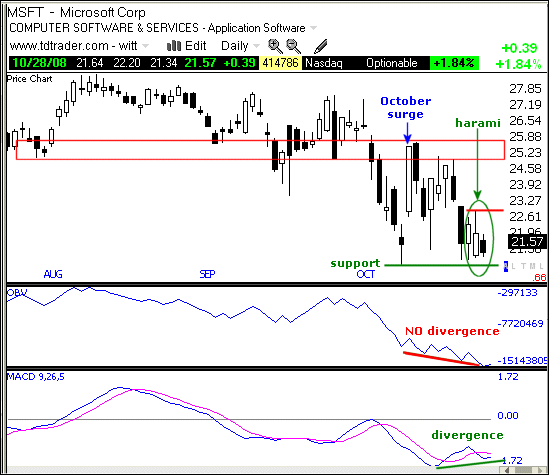
| Pricewise, Microsoft (MSFT) has been moving lower the last few months. MSFT reversed in early October with a big gap and long white candlestick (blue arrow), but returned to this reversal low over the last five days. With two white candlesticks over the last three days, the stock is finding some support around 21 and trying to firm. |
| The last two candlesticks formed a harami, which also marks an inside day (Figure 1). The black candlestick is within the range of the white candlestick, and this denotes indecision. The trend is clearly down and sudden indecision can foreshadow a reversal, though confirmation is required. Look for a break above the harami high (red line) to provide confirmation and clear the way for an oversold bounce. The upside target would be the next resistance zone around 25 (red box). |

|
| FIGURE 1: MSFT, DAILY. Could there be a bounce coming for this stock? |
| Graphic provided by: TeleChart2007. |
| |
| Indicators are split with the on-balance volume (OBV) showing weakness and the moving average convergence/divergence (MACD) showing a positive divergence. While MSFT firmed over the last few weeks, the OBV line moved lower as selling pressure continued. In contrast, the MACD hit its low in early October and remains above its prior low. This working positive divergence shows less downside momentum on the support test, but the MACD remains short of a bullish signal. Look for this momentum indicator to move above its signal line to trigger a bullish signal. |
Arthur Hill is currently editor of TDTrader.com, a website specializing in trading strategies, sector/industry specific breadth stats and overall technical analysis. He passed the Society of Technical Analysts (STA London) diploma exam with distinction is a Certified Financial Technician (CFTe). Prior to TD Trader, he was the Chief Technical Analyst for Stockcharts.com and the main contributor to the ChartSchool.
| Title: | Editor |
| Company: | TDTrader.com |
| Address: | Willem Geetsstraat 17 |
| Mechelen, B2800 | |
| Phone # for sales: | 3215345465 |
| Website: | www.tdtrader.com |
| E-mail address: | arthurh@tdtrader.com |
Traders' Resource Links | |
| TDTrader.com has not added any product or service information to TRADERS' RESOURCE. | |
Click here for more information about our publications!
PRINT THIS ARTICLE

Request Information From Our Sponsors
- VectorVest, Inc.
- Executive Premier Workshop
- One-Day Options Course
- OptionsPro
- Retirement Income Workshop
- Sure-Fire Trading Systems (VectorVest, Inc.)
- Trading as a Business Workshop
- VectorVest 7 EOD
- VectorVest 7 RealTime/IntraDay
- VectorVest AutoTester
- VectorVest Educational Services
- VectorVest OnLine
- VectorVest Options Analyzer
- VectorVest ProGraphics v6.0
- VectorVest ProTrader 7
- VectorVest RealTime Derby Tool
- VectorVest Simulator
- VectorVest Variator
- VectorVest Watchdog
- StockCharts.com, Inc.
- Candle Patterns
- Candlestick Charting Explained
- Intermarket Technical Analysis
- John Murphy on Chart Analysis
- John Murphy's Chart Pattern Recognition
- John Murphy's Market Message
- MurphyExplainsMarketAnalysis-Intermarket Analysis
- MurphyExplainsMarketAnalysis-Visual Analysis
- StockCharts.com
- Technical Analysis of the Financial Markets
- The Visual Investor
