HOT TOPICS LIST
- MACD
- Fibonacci
- RSI
- Gann
- ADXR
- Stochastics
- Volume
- Triangles
- Futures
- Cycles
- Volatility
- ZIGZAG
- MESA
- Retracement
- Aroon
INDICATORS LIST
LIST OF TOPICS
PRINT THIS ARTICLE
by Arthur Hill
Apple is holding up better than the broader market as it consolidates near support, but a range break is needed to trigger the next signal.
Position: Hold
Arthur Hill
Arthur Hill is currently editor of TDTrader.com, a website specializing in trading strategies, sector/industry specific breadth stats and overall technical analysis. He passed the Society of Technical Analysts (STA London) diploma exam with distinction is a Certified Financial Technician (CFTe). Prior to TD Trader, he was the Chief Technical Analyst for Stockcharts.com and the main contributor to the ChartSchool.
PRINT THIS ARTICLE
CONSOLID FORMATION
Apple Consolidates Near Support
10/28/08 09:09:23 AMby Arthur Hill
Apple is holding up better than the broader market as it consolidates near support, but a range break is needed to trigger the next signal.
Position: Hold
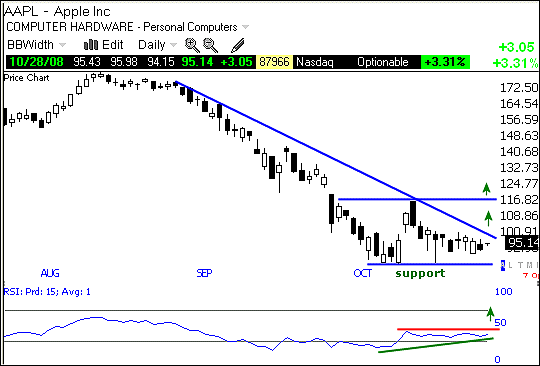
| Figure 1 shows daily candlesticks over the last three months. Apple (AAPL) declined to around 86 in early October and bounced with a gap in mid-October. However, there was no follow-through and the stock is testing support with a pullback over the last two weeks. The ability to hold the early October lows is promising, but the stock remains short of the breakout needed to reverse the current downtrend. Look for a move above the September trendline to break the fall and a move above the October high to reverse the medium-term downtrend. |

|
| FIGURE 1: AAPL, DAILY. Apple declined to around 86 in early October and bounced with a gap in mid-October. |
| Graphic provided by: TeleChart2007. |
| |
| The bottom indicator window shows the 15-day relative strength index (RSI). The indicator was oversold in September and early October, but moved from oversold levels over the last few weeks. As with the stock, the RSI remains short of a breakout that would turn momentum bullish. A break above the mid-point — 50 — would turn momentum bullish and could be used to validate a trendline breakout in the stock. |
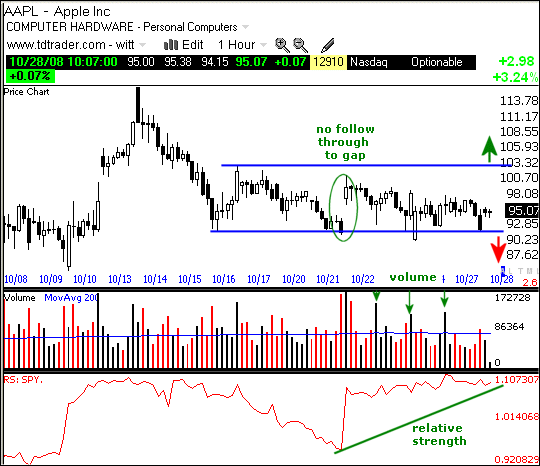
| Figure 2 shows 60-minute candlesticks over the last three weeks. AAPL has been locked in a pretty tight trading range since October 16 (blue lines). Note the October 22nd gap (green oval) failed to hold and the stock returned to support a few days later. In fact, this consolidation has a slight downward drift. A break from this consolidation would trigger the next signal. |

|
| FIGURE 2: AAPL, HOURLY. This stock has been locked in a tight trading range since October 16 (blue lines). Note the October 22nd gap (green oval) failed to hold and the stock returned to support a few days later. |
| Graphic provided by: TeleChart2007. |
| |
| Volume and relative strength point to an upside breakout. The green arrows show volume bars on up days that were above average. In general, upside volume is outpacing downside volume. The red line shows the relative strength comparative, which shows AAPL relative to the S&P 500 exchange traded fund (SPY). The indicator is trading near its highs, and this shows relative strength. While volume and relative strength point to a breakout, price is the ultimate arbiter and a breakout is needed for final validation. |
Arthur Hill is currently editor of TDTrader.com, a website specializing in trading strategies, sector/industry specific breadth stats and overall technical analysis. He passed the Society of Technical Analysts (STA London) diploma exam with distinction is a Certified Financial Technician (CFTe). Prior to TD Trader, he was the Chief Technical Analyst for Stockcharts.com and the main contributor to the ChartSchool.
| Title: | Editor |
| Company: | TDTrader.com |
| Address: | Willem Geetsstraat 17 |
| Mechelen, B2800 | |
| Phone # for sales: | 3215345465 |
| Website: | www.tdtrader.com |
| E-mail address: | arthurh@tdtrader.com |
Traders' Resource Links | |
| TDTrader.com has not added any product or service information to TRADERS' RESOURCE. | |
Click here for more information about our publications!
Comments
Date: 10/29/08Rank: 4Comment:

Request Information From Our Sponsors
- StockCharts.com, Inc.
- Candle Patterns
- Candlestick Charting Explained
- Intermarket Technical Analysis
- John Murphy on Chart Analysis
- John Murphy's Chart Pattern Recognition
- John Murphy's Market Message
- MurphyExplainsMarketAnalysis-Intermarket Analysis
- MurphyExplainsMarketAnalysis-Visual Analysis
- StockCharts.com
- Technical Analysis of the Financial Markets
- The Visual Investor
- VectorVest, Inc.
- Executive Premier Workshop
- One-Day Options Course
- OptionsPro
- Retirement Income Workshop
- Sure-Fire Trading Systems (VectorVest, Inc.)
- Trading as a Business Workshop
- VectorVest 7 EOD
- VectorVest 7 RealTime/IntraDay
- VectorVest AutoTester
- VectorVest Educational Services
- VectorVest OnLine
- VectorVest Options Analyzer
- VectorVest ProGraphics v6.0
- VectorVest ProTrader 7
- VectorVest RealTime Derby Tool
- VectorVest Simulator
- VectorVest Variator
- VectorVest Watchdog
