HOT TOPICS LIST
- MACD
- Fibonacci
- RSI
- Gann
- ADXR
- Stochastics
- Volume
- Triangles
- Futures
- Cycles
- Volatility
- ZIGZAG
- MESA
- Retracement
- Aroon
INDICATORS LIST
LIST OF TOPICS
PRINT THIS ARTICLE
by Donald W. Pendergast, Jr.
After enduring months of record selloffs, Newmont Mining and the Gold Bugs index may be close to a reversal zone.
Position: N/A
Donald W. Pendergast, Jr.
Donald W. Pendergast is a financial markets consultant who offers specialized services to stock brokers and high net worth individuals who seek a better bottom line for their portfolios.
PRINT THIS ARTICLE
FIBONACCI
Newmont And The Gold Bugs Are Very Oversold
10/29/08 08:32:18 AMby Donald W. Pendergast, Jr.
After enduring months of record selloffs, Newmont Mining and the Gold Bugs index may be close to a reversal zone.
Position: N/A
| It's hard to believe that the AMEX Gold Bugs index was over 519 a mere eight months ago, as it has lost more than two-thirds of its index value since those days. Since then, precious metals stocks like Newmont, Goldcorp, and Agnico-Eagle have all been major casualties as the global market selloff in stocks and commodities routed everything in its wake, including these major gold producers. The charts, however, do seem to be offering some hope that a bottom in precious metals stocks may be approaching. |
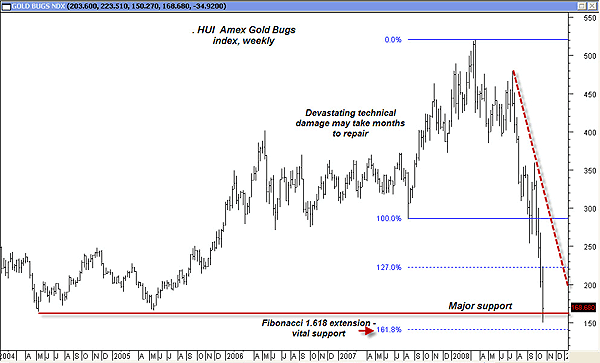
| Let's look at the weekly chart of the AMEX Gold Bugs index first (Figure 1); the technical damage is extreme, to say the least, but the index price is still above the major support line that extends back to 2004–05, having completed (for the moment) a successful test of that important price zone. In addition, the price has failed to drop all the way down to the Fibonacci 1.618 extension level — for the time being. If the broad markets put in a firm low soon, expect the Gold Bugs index to bottom at about the same time. If the broad markets keep selling off, well, the 'Bugs might just retrace most of the gains made since early in this decade, no small feat for an index that had been up more than 12-fold since late 2000! |

|
| FIGURE 1: AMEX GOLD BUGS, WEEKLY. The AMEX Gold Bugs index could react violently if a short-squeeze were to take place. |
| Graphic provided by: MetaStock. |
| Graphic provided by: TechSmith. |
| |
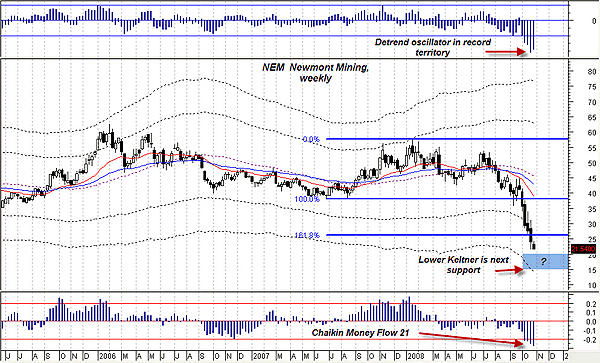
| Next, let's examine the weekly chart of Newmont Mining, one of the larger component stocks in the Gold Bugs index — it makes up 11% of the total index value and is a reasonably good proxy for the index as a whole (Figure 2). Newmont has certainly taken a dive, but it's still in better technical shape, having fallen less in percentage terms. Other than that, Newmont presents a mixed picture of technical evidence. Price blasted right through the Fibonacci 1.618 extension level, and there isn't much support between $15–20, although the lower Keltner band, (set at 6 + standard deviations) would likely offer at least some interference on further weakness. On a more hopeful note, the detrend oscillator (the top pane of Newmont chart) is wildly oversold and is in record negative territory. That indicator is also beginning to turn higher, also a potential sign of a bottom. |

|
| FIGURE 2: NEWMONT MINING, WEEKLY. Newmont Mining's chart offers mixed technical clues. |
| Graphic provided by: MetaStock. |
| Graphic provided by: TechSmith. |
| |
| Given all of the global financial bailouts, $2 trillion-plus now added to the money supply in the United States alone, serious consumer price inflation is a near certainty in the next few years, and that's usually when gold and gold stocks like Newmont begin to earn their keep. So while the current technicals are sobering, the fundamentals for gold and gold stocks still appear to be bright. |
Donald W. Pendergast is a financial markets consultant who offers specialized services to stock brokers and high net worth individuals who seek a better bottom line for their portfolios.
| Title: | Writer, market consultant |
| Company: | Linear Trading Systems LLC |
| Jacksonville, FL 32217 | |
| Phone # for sales: | 904-239-9564 |
| E-mail address: | lineartradingsys@gmail.com |
Traders' Resource Links | |
| Linear Trading Systems LLC has not added any product or service information to TRADERS' RESOURCE. | |
Click here for more information about our publications!
Comments
Date: 10/29/08Rank: 4Comment:
Date: 11/02/08Rank: 5Comment:

Request Information From Our Sponsors
- StockCharts.com, Inc.
- Candle Patterns
- Candlestick Charting Explained
- Intermarket Technical Analysis
- John Murphy on Chart Analysis
- John Murphy's Chart Pattern Recognition
- John Murphy's Market Message
- MurphyExplainsMarketAnalysis-Intermarket Analysis
- MurphyExplainsMarketAnalysis-Visual Analysis
- StockCharts.com
- Technical Analysis of the Financial Markets
- The Visual Investor
- VectorVest, Inc.
- Executive Premier Workshop
- One-Day Options Course
- OptionsPro
- Retirement Income Workshop
- Sure-Fire Trading Systems (VectorVest, Inc.)
- Trading as a Business Workshop
- VectorVest 7 EOD
- VectorVest 7 RealTime/IntraDay
- VectorVest AutoTester
- VectorVest Educational Services
- VectorVest OnLine
- VectorVest Options Analyzer
- VectorVest ProGraphics v6.0
- VectorVest ProTrader 7
- VectorVest RealTime Derby Tool
- VectorVest Simulator
- VectorVest Variator
- VectorVest Watchdog
