HOT TOPICS LIST
- MACD
- Fibonacci
- RSI
- Gann
- ADXR
- Stochastics
- Volume
- Triangles
- Futures
- Cycles
- Volatility
- ZIGZAG
- MESA
- Retracement
- Aroon
INDICATORS LIST
LIST OF TOPICS
PRINT THIS ARTICLE
by James Kupfer
Gold appears to be in a prime spot for a reversal.
Position: Buy
James Kupfer
Mr. Kupfer is a market professional and amateur stock market commentator. Disclosure: It is likely that Mr. Kupfer has or will enter a position in any security he writes about.
PRINT THIS ARTICLE
FIBONACCI
Is Gold Still Golden?
10/28/08 08:59:00 AMby James Kupfer
Gold appears to be in a prime spot for a reversal.
Position: Buy
| Gold has taken a mighty tumble over the last few months, falling from a high of more than $1,000 an ounce to around $735. Now, a convergence of Fibonacci support zones and a significant new support zone at the current price level indicate that this might be a prime time to buy gold for at least a significant bounce. |
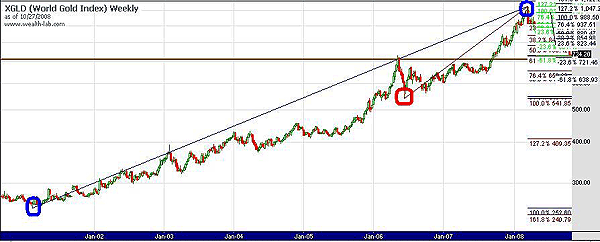
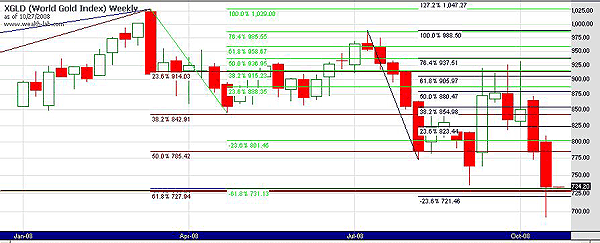
| On the two weekly gold charts seen in Figures 1 and 2, I have drawn significant Fibonacci retracement levels. There is such a clutter of Fibonacci levels that the charts are included primarily just to show where the levels are drawn to and from. |
| Circles in blue denote the oldest Fibonacci level, starting with the start of the bull market in gold from February 2001 to the recent top in March 2008. The 38.2% retracement level is at $732.42. Next is the retracement level formed between the June 2007 low and March 2008 top, which is shown at the start with a red circle. The 61.8% retracement level for that move is $727.94. See Figure 1. |

|
| FIGURE 1: XGLD, WEEKLY. Circles in blue denote the oldest Fibonacci level, starting with the beginning of the bull market in gold from February 2001 to the recent top in March 2008. |
| Graphic provided by: Wealth-lab. |
| |
| Moving to the closer view (Figure 2), you can see the light green Fibonacci retracement level calculated between the March 2008 top and April 2008 bottom. In this case, 161.8% of that move leads to a price target of $731. Finally, 123.6% of the move from July to August suggests a price target of $721.46. As mentioned previously and shown as a brown line on the charts is the May 2006 top at $730. As a previous level of significant resistance, it now turns into a support line. |

|
| FIGURE 2: XGLD, WEEKLY. The light green retracement level is calculated between March 2008 top and April 2008 bottom. |
| Graphic provided by: Wealth-lab. |
| |
| In summary, four different Fibonacci retracement levels and an old support point all indicate that gold is currently at a level of significant support. Four of the five support prices are within $2.50 of each other. The last and least reliable since it is of the shortest time period and a less commonly used Fibonacci number is still within $9 of the other levels. While gold can move lower, like it did last week, without breaking the support levels, prices now appear in a favorable position to buy. |
Mr. Kupfer is a market professional and amateur stock market commentator. Disclosure: It is likely that Mr. Kupfer has or will enter a position in any security he writes about.
Click here for more information about our publications!
Comments
Date: 10/29/08Rank: 3Comment:

|

Request Information From Our Sponsors
- StockCharts.com, Inc.
- Candle Patterns
- Candlestick Charting Explained
- Intermarket Technical Analysis
- John Murphy on Chart Analysis
- John Murphy's Chart Pattern Recognition
- John Murphy's Market Message
- MurphyExplainsMarketAnalysis-Intermarket Analysis
- MurphyExplainsMarketAnalysis-Visual Analysis
- StockCharts.com
- Technical Analysis of the Financial Markets
- The Visual Investor
- VectorVest, Inc.
- Executive Premier Workshop
- One-Day Options Course
- OptionsPro
- Retirement Income Workshop
- Sure-Fire Trading Systems (VectorVest, Inc.)
- Trading as a Business Workshop
- VectorVest 7 EOD
- VectorVest 7 RealTime/IntraDay
- VectorVest AutoTester
- VectorVest Educational Services
- VectorVest OnLine
- VectorVest Options Analyzer
- VectorVest ProGraphics v6.0
- VectorVest ProTrader 7
- VectorVest RealTime Derby Tool
- VectorVest Simulator
- VectorVest Variator
- VectorVest Watchdog
