HOT TOPICS LIST
- MACD
- Fibonacci
- RSI
- Gann
- ADXR
- Stochastics
- Volume
- Triangles
- Futures
- Cycles
- Volatility
- ZIGZAG
- MESA
- Retracement
- Aroon
INDICATORS LIST
LIST OF TOPICS
PRINT THIS ARTICLE
by Koos van der Merwe
Has the time come?
Position: Accumulate
Koos van der Merwe
Has been a technical analyst since 1969, and has worked as a futures and options trader with First Financial Futures in Johannesburg, South Africa.
PRINT THIS ARTICLE
Buy, Buy, Buy
10/27/08 12:24:03 PMby Koos van der Merwe
Has the time come?
Position: Accumulate
| The story goes that before the great market crash of 1929, Joseph Kennedy, father of US President John F. Kennedy, stopped to have his shoes polished. The young boy who polished his shoes gave him advice on what shares he should buy. Afterward, Kennedy walked into his office and sold all his shares, moving into cash. He was wise enough to realize that when his shoe polisher, a young boy with minimal knowledge of the market, could advise him on what to buy, then it was time for him to get out of the market and sell, and he did. Recently, my ex son-in-law, who knows absolutely nothing about the market, advised me to invest in US Treasury bills. Then he asked me, "What is a T-bill?" I was stunned. With interest rates falling; with brokers thinking of jumping out of high-rise windows -- if they could open them -- and with the financial world collapsing all around us, was he inadvertently telling me that the bottom was in sight, and that I should do the opposite of what everyone else is doing? In other words, was he telling me to become a "Joe Kennedy" but at the market bottom, not the top? |

|
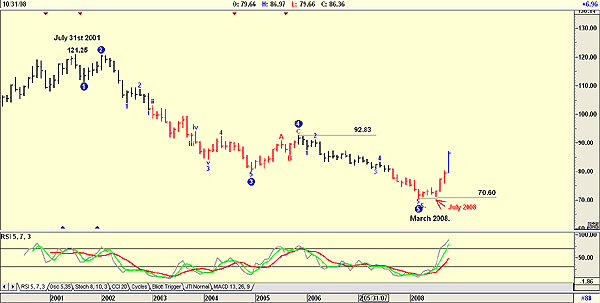
| FIGURE 1: US DOLLAR INDEX, MONTHLY |
| Graphic provided by: AdvancedGET. |
| |
| Figure 1 is the monthly chart of the US Dollar Index. In it we can see how the index fell as the US dollar weakened from July 2001 to March 2008. Why? It is the result of the world banks selling US T-bills as they looked for cash to prop up their ailing businesses. Then in July 2008, the US Dollar Index started to strengthen. Does this mean that banks no longer had to sell T-bills to find cash because of government assistance, or were there simply no more T-bills to sell? At any rate, from then on, the US Dollar Index started to strengthen, and the relative strength index (RSI) is at overbought levels, suggesting weakness may be ahead. |

|
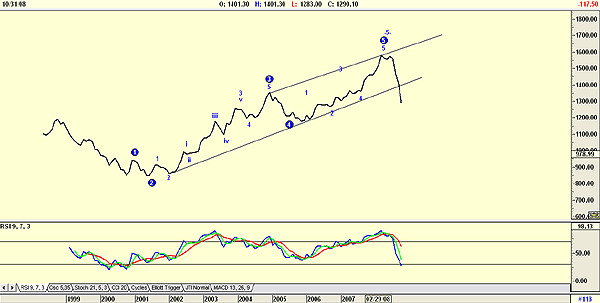
| FIGURE 2: EURO, MONTHLY |
| Graphic provided by: AdvancedGET. |
| |
| A look at any currency chart confirms this. I have chosen the euro, and in it you can see how the euro has fallen sharply as the US dollar strengthened across the world as money rushed to buy US T-bills. Now it has fallen below its support line and the RSI hints at oversold levels. Is the euro suggesting strength once more as T-bills are no longer bought? (See Figure 2.) |

|
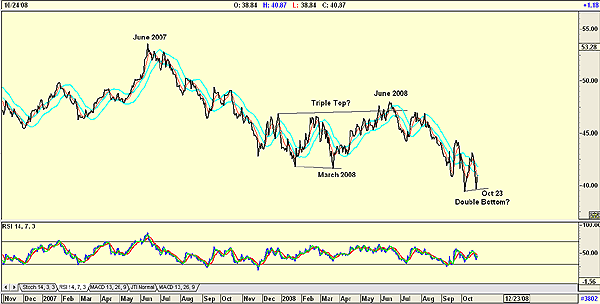
| FIGURE 3: TREASURY YIELD OPTION, MONTHLY |
| Graphic provided by: AdvancedGET. |
| |
| Figure 3 is the CBOE Treasury Yield Option, and it shows how from June 2007 the price fell, forming a double bottom in March 2008, rising into June 2008, and forming what many believed was a triple top before falling to form what could well be a double bottom on October 23. The RSI is rising from oversold levels suggesting that T-bills are being bought. A study of the RSI over the recent past showed that it never truly rose above 50 before falling back. This suggests present buying could be temporary. Protect your cash by buying T-bills. That was the recent maxim as the financial crisis worsened, but it now appears to have changed. Charts and the Joe Kennedy maxim seem to suggest that we should now be contrarian and do the Warren Buffett -- look for stocks offering good yields. So it's buy, buy, buy! |
Has been a technical analyst since 1969, and has worked as a futures and options trader with First Financial Futures in Johannesburg, South Africa.
| Address: | 3256 West 24th Ave |
| Vancouver, BC | |
| Phone # for sales: | 6042634214 |
| E-mail address: | petroosp@gmail.com |
Click here for more information about our publications!
Comments
Date: 10/28/08Rank: 5Comment:
Date: 10/29/08Rank: 4Comment:

Request Information From Our Sponsors
- StockCharts.com, Inc.
- Candle Patterns
- Candlestick Charting Explained
- Intermarket Technical Analysis
- John Murphy on Chart Analysis
- John Murphy's Chart Pattern Recognition
- John Murphy's Market Message
- MurphyExplainsMarketAnalysis-Intermarket Analysis
- MurphyExplainsMarketAnalysis-Visual Analysis
- StockCharts.com
- Technical Analysis of the Financial Markets
- The Visual Investor
- VectorVest, Inc.
- Executive Premier Workshop
- One-Day Options Course
- OptionsPro
- Retirement Income Workshop
- Sure-Fire Trading Systems (VectorVest, Inc.)
- Trading as a Business Workshop
- VectorVest 7 EOD
- VectorVest 7 RealTime/IntraDay
- VectorVest AutoTester
- VectorVest Educational Services
- VectorVest OnLine
- VectorVest Options Analyzer
- VectorVest ProGraphics v6.0
- VectorVest ProTrader 7
- VectorVest RealTime Derby Tool
- VectorVest Simulator
- VectorVest Variator
- VectorVest Watchdog
