HOT TOPICS LIST
- MACD
- Fibonacci
- RSI
- Gann
- ADXR
- Stochastics
- Volume
- Triangles
- Futures
- Cycles
- Volatility
- ZIGZAG
- MESA
- Retracement
- Aroon
INDICATORS LIST
LIST OF TOPICS
PRINT THIS ARTICLE
by Donald W. Pendergast, Jr.
The Oil Index and Airline Index charts suggest that airlines are the stronger sector of the two -- for the moment.
Position: Buy
Donald W. Pendergast, Jr.
Donald W. Pendergast is a financial markets consultant who offers specialized services to stock brokers and high net worth individuals who seek a better bottom line for their portfolios.
PRINT THIS ARTICLE
FIBONACCI
Oil vs. Airlines: Airlines Poised To Take Flight?
10/27/08 12:18:11 PMby Donald W. Pendergast, Jr.
The Oil Index and Airline Index charts suggest that airlines are the stronger sector of the two -- for the moment.
Position: Buy
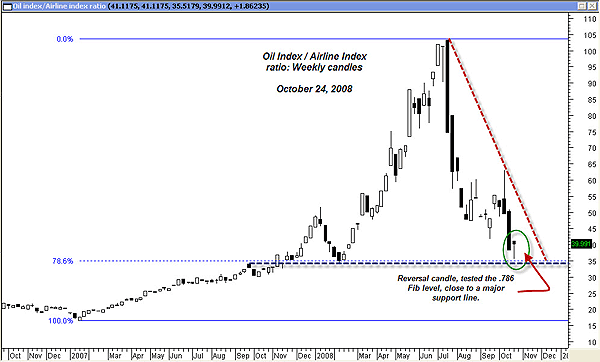
| For the past few years, the decision to be long oil/oil services stocks and short airline stocks was a comparatively easy choice to make. As crude oil soared, airline balance sheets came unglued, losses mounted, and their market capitalizations plummeted. Meanwhile, energy services/energy industry outfits like Halliburton (HAL) and Petrobras (PBR) continued to make new highs with ease. See Figure 1. |

|
| FIGURE 1: OIL AND AIRLINES. The oil index/airline index ratio may be due for a technical reaction higher. |
| Graphic provided by: MetaStock. |
| Graphic provided by: TechSmith. |
| |
| Then July 2008 arrived, and the entire situation reversed with a speed and violence rarely seen in the financial markets. Crude oil, along with many other commodities, heavily overbought by hedge funds and other deep-pocketsspeculators, were sold with abandon as the global financial situation precipitated a massive rush to the safety of cash. As the price of oil was crushed, the share prices of most energy/energy services companies were also mashed like soggy cigarette butts on the sidewalks of Manhattan, losing even more in percentage terms than crude did. |

|
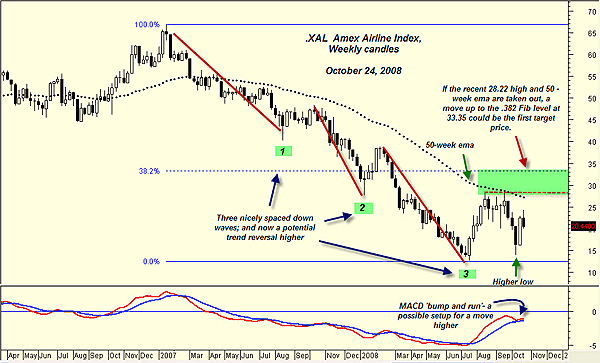
| FIGURE 2: XAL, WEEKLY. The airline index appears to be in better technical shape than the oil index. |
| Graphic provided by: MetaStock. |
| Graphic provided by: TechSmith. |
| |
| The resulting damage is reflected in the weekly Oil Index /Airline Index ratio chart, which is down by approximately 65% since the July high. Generally speaking, the Oil Index component of the ratio (XOI) has been underperforming more than the Airline Index component has been outperforming, although the recent technical action in the Airline Index seems to imply that the worst may be over, and that a modest uptrending phase may be imminent. The XOI/XAL weekly ratio chart also appears to bear this out, even though the large reversal candle off of two important support levels (the Fibonacci 0.786 retracement and a prior major support line) suggests that the ratio could be temporarily oversold. See Figure 2. |

|
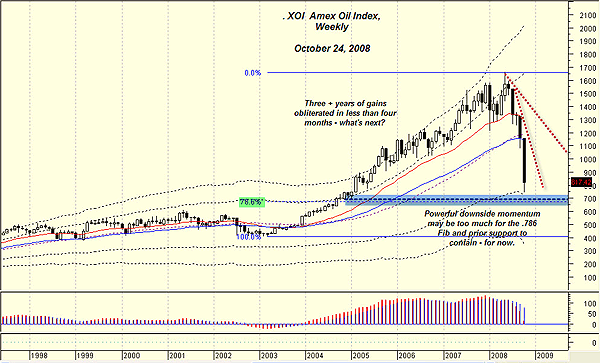
| FIGURE 3: OIL, WEEKLY. The oil index has A powerful downside momentum, but a short squeeze could be devastating. |
| Graphic provided by: MetaStock. |
| Graphic provided by: TechSmith. |
| |
| The weekly Airlines Index chart (XAL) has a number of interesting technical confluences that suggest that the worst phase of the selloffs are over and that a new uptrending phase (or a double bottom) may be taking root. The three well-spaced down waves are fairly close in ratio (time and price), and many completed bear markets also seem to manifest such price action before hammering out a major low. The bump-and-run moving average convergence/divergence (MACD) action also looks bullish, as does the higher low, established two weeks ago. Overhead, XAL now must clear the recent high at 28.22 and the 50-week exponential moving average (EMA), currently near 27.00. If and when that happens, the Fibonacci 0.382 barrier near 33.35 might be a likely target price for traders. |
| Finally, let's examine the monthly Oil Index chart, which is the one displaying some of the worst technical damage in recent memory. Down by more than 30% in just three and a half weeks, there appears to be little standing in its way other than a significant Fibonacci retracement level (0.786) and a previous support line. However, given that the index is off by more than 50% since July, the probabilities of a reaction move higher seem to be increasing by the day, meaning that those short the oil index component stocks would do well to tighten their stops and/or consider easing up their exposure to the short side. See Figure 3. Given all of the technical evidence, the charts for the moment appear to favor the airlines index on the long side and the oil index as a hold/cover situation. |
Donald W. Pendergast is a financial markets consultant who offers specialized services to stock brokers and high net worth individuals who seek a better bottom line for their portfolios.
| Title: | Writer, market consultant |
| Company: | Linear Trading Systems LLC |
| Jacksonville, FL 32217 | |
| Phone # for sales: | 904-239-9564 |
| E-mail address: | lineartradingsys@gmail.com |
Traders' Resource Links | |
| Linear Trading Systems LLC has not added any product or service information to TRADERS' RESOURCE. | |
Click here for more information about our publications!
PRINT THIS ARTICLE

Request Information From Our Sponsors
- VectorVest, Inc.
- Executive Premier Workshop
- One-Day Options Course
- OptionsPro
- Retirement Income Workshop
- Sure-Fire Trading Systems (VectorVest, Inc.)
- Trading as a Business Workshop
- VectorVest 7 EOD
- VectorVest 7 RealTime/IntraDay
- VectorVest AutoTester
- VectorVest Educational Services
- VectorVest OnLine
- VectorVest Options Analyzer
- VectorVest ProGraphics v6.0
- VectorVest ProTrader 7
- VectorVest RealTime Derby Tool
- VectorVest Simulator
- VectorVest Variator
- VectorVest Watchdog
- StockCharts.com, Inc.
- Candle Patterns
- Candlestick Charting Explained
- Intermarket Technical Analysis
- John Murphy on Chart Analysis
- John Murphy's Chart Pattern Recognition
- John Murphy's Market Message
- MurphyExplainsMarketAnalysis-Intermarket Analysis
- MurphyExplainsMarketAnalysis-Visual Analysis
- StockCharts.com
- Technical Analysis of the Financial Markets
- The Visual Investor
