

HOT TOPICS LIST
- MACD
- Fibonacci
- RSI
- Gann
- ADXR
- Stochastics
- Volume
- Triangles
- Futures
- Cycles
- Volatility
- ZIGZAG
- MESA
- Retracement
- Aroon
INDICATORS LIST
LIST OF TOPICS
PRINT THIS ARTICLE
by Arthur Hill
QQQQ formed a descending triangle over the last few days, and a support break would signal a continuation of the bigger downtrend.
Position: Sell
Arthur Hill
Arthur Hill is currently editor of TDTrader.com, a website specializing in trading strategies, sector/industry specific breadth stats and overall technical analysis. He passed the Society of Technical Analysts (STA London) diploma exam with distinction is a Certified Financial Technician (CFTe). Prior to TD Trader, he was the Chief Technical Analyst for Stockcharts.com and the main contributor to the ChartSchool.
PRINT THIS ARTICLE
DESCENDING TRIANGLES
A Descending Triangle For QQQQ
10/24/08 10:11:53 AMby Arthur Hill
QQQQ formed a descending triangle over the last few days, and a support break would signal a continuation of the bigger downtrend.
Position: Sell
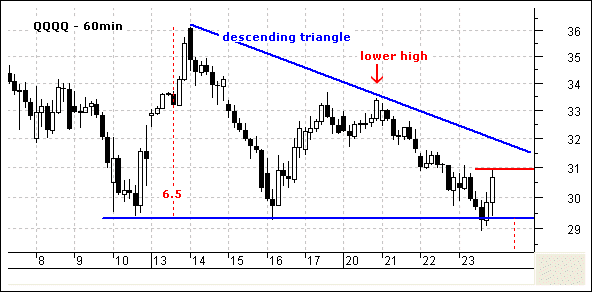
| Figure 1 shows the NASDAQ 100 ETF (QQQQ) with a descending triangle on the 60-minute charts. This time frame expands on the last 10 trading days to show the pattern quite well. There are three relatively equal lows around 29.5 and a lower high around 33.5. This lower high shows selling pressure appearing well below the prior high. Sellers came in earlier than the prior high at 36, and this is bearish. The relatively equal lows show the last bastion of demand (support). |
|
| FIGURE 1: QQQQ, HOURLY. Note the descending triangle. |
| Graphic provided by: MetaStock. |
| |
| A break below support would confirm the pattern and project further weakness. QQQQ was on the verge of breaking support on Thursday, but bounced back with a late afternoon recovery. Another breach would project further weakness toward 23–25. The height of the pattern is subtracted from the support break for the downside projection (36 - 29.5 = 6.5, 29.5 - 6.5 = 23). |
|
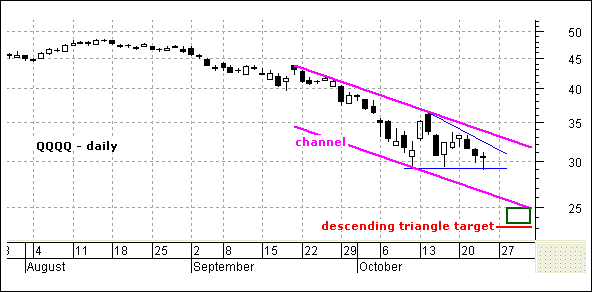
| FIGURE 2: QQQQ, DAILY. Note the daily candlesticks with the descending triangle and a falling price channel. |
| Graphic provided by: MetaStock. |
| |
| Figure 2 shows daily candlesticks with the descending triangle and a falling price channel. The red line shows the descending triangle target around 23. For the channel, I drew the upper trendline first and then the lower trendline was drawn parallel. It extends to around 25–26 early next week, and this area could also act as support. Considering the channel extension and descending triangle target, I would mark the next support zone around 23–25. |
Arthur Hill is currently editor of TDTrader.com, a website specializing in trading strategies, sector/industry specific breadth stats and overall technical analysis. He passed the Society of Technical Analysts (STA London) diploma exam with distinction is a Certified Financial Technician (CFTe). Prior to TD Trader, he was the Chief Technical Analyst for Stockcharts.com and the main contributor to the ChartSchool.
| Title: | Editor |
| Company: | TDTrader.com |
| Address: | Willem Geetsstraat 17 |
| Mechelen, B2800 | |
| Phone # for sales: | 3215345465 |
| Website: | www.tdtrader.com |
| E-mail address: | arthurh@tdtrader.com |
Traders' Resource Links | |
| TDTrader.com has not added any product or service information to TRADERS' RESOURCE. | |
Click here for more information about our publications!
Comments

Request Information From Our Sponsors
- StockCharts.com, Inc.
- Candle Patterns
- Candlestick Charting Explained
- Intermarket Technical Analysis
- John Murphy on Chart Analysis
- John Murphy's Chart Pattern Recognition
- John Murphy's Market Message
- MurphyExplainsMarketAnalysis-Intermarket Analysis
- MurphyExplainsMarketAnalysis-Visual Analysis
- StockCharts.com
- Technical Analysis of the Financial Markets
- The Visual Investor
- VectorVest, Inc.
- Executive Premier Workshop
- One-Day Options Course
- OptionsPro
- Retirement Income Workshop
- Sure-Fire Trading Systems (VectorVest, Inc.)
- Trading as a Business Workshop
- VectorVest 7 EOD
- VectorVest 7 RealTime/IntraDay
- VectorVest AutoTester
- VectorVest Educational Services
- VectorVest OnLine
- VectorVest Options Analyzer
- VectorVest ProGraphics v6.0
- VectorVest ProTrader 7
- VectorVest RealTime Derby Tool
- VectorVest Simulator
- VectorVest Variator
- VectorVest Watchdog