

HOT TOPICS LIST
- MACD
- Fibonacci
- RSI
- Gann
- ADXR
- Stochastics
- Volume
- Triangles
- Futures
- Cycles
- Volatility
- ZIGZAG
- MESA
- Retracement
- Aroon
INDICATORS LIST
LIST OF TOPICS
PRINT THIS ARTICLE
by Alan R. Northam
The S&P 500 looks like it's tracing out a symmetrical triangle wave formation, but this may not be a valid wave form. Here's why.
Position: N/A
Alan R. Northam
Alan Northam lives in the Dallas, Texas area and as an electronic engineer gave him an analytical mind from which he has developed a thorough knowledge of stock market technical analysis. His abilities to analyze the future direction of the stock market has allowed him to successfully trade of his own portfolio over the last 30 years. Mr. Northam is now retired and trading the stock market full time. You can reach him at inquiry@tradersclassroom.com or by visiting his website at http://www.tradersclassroom.com. You can also follow him on Twitter @TradersClassrm.
PRINT THIS ARTICLE
ELLIOTT WAVE
S&P 500 Triangle?
10/24/08 01:42:43 PMby Alan R. Northam
The S&P 500 looks like it's tracing out a symmetrical triangle wave formation, but this may not be a valid wave form. Here's why.
Position: N/A
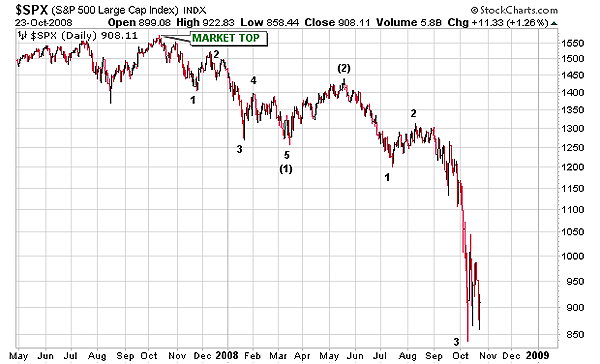
| Figure 1 shows the daily price bars of the Standard & Poor's 500 over the last 18 months. This chart shows that the S&P 500 made a major bull market top on October 11, 2007. Since that time, this large-cap index has been trading lower and has completed waves (1) and (2) of a five-wave formation, according to Elliott wave theory. With waves (1) and (2) complete, wave (3) down is now in progress to be followed by a corrective wave (4) and a final wave (5) down. Further, wave (3) down is unfolding in five subwaves: waves 1, 2, 3, 4, and 5 with waves 1, 2, and 3 complete. This is known as the fractal nature of the wave theory. Following the completion of wave 3, it looks as if the S&P 500 is forming a symmetrical triangle. According to Elliott wave theory, symmetrical triangles often form in wave 4. Therefore, if this pattern is a symmetrical triangle, then wave 4 is still in progress, with wave 5 to the downside to follow once the symmetrical triangle has been completed. To view this developing symmetrical triangle pattern in more detail, it is necessary to go to a smaller time frame. I have chosen the 60-minute time frame for this analysis. |
|
| FIGURE 1: S&P 500, DAILY. This figure shows the Elliott wave count. The wave count shows that the index is currently in wave (3) down and is subdividing into five smaller waves. |
| Graphic provided by: StockCharts.com. |
| |
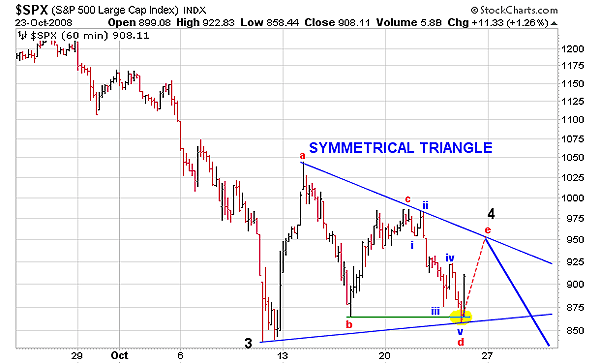
| Figure 2 is that of the 60-minute price bar chart of the S&P 500. Here, I have shown the wave pattern that has developed since the completion of wave 3 as a symmetrical triangle. Symmetrical triangles are composed of five overlapping waves and are labeled according to Elliott wave theory convention as waves a, b, c, d, and e. Note that wave d has just been completed and wave e is just getting under way. Once wave e is complete, then that will also complete wave 4 and will initiate the beginning of wave 5 down that will lead to lower prices. |
| Two things are wrong with this symmetrical triangle, however, that invalidates it as a true symmetrical triangle. First of all, the completion of wave d has fallen below the low of wave b. Both R.N. Elliott, who developed the wave theory, and Thomas N. Bulkowski, who wrote Encyclopedia Of Chart Patterns, define a symmetrical triangle as a wave form that produces lower highs and higher lows. Therefore, when wave d fell below wave b, the symmetrical triangle formation became invalid. Second, R.N. Elliott defines a symmetrical triangle as five waves with each wave composed of three subwaves. When we look at wave d, five subwaves are clearly visible. This also invalidates the formation as a true symmetrical triangle. As a result, I relegate this formation to alternate technical analysis status. |
|
| |
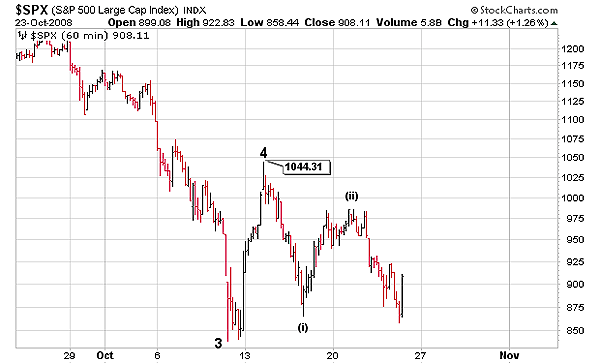
| Figure 3 shows my preferred technical analysis of the wave pattern that has developed since the completion of wave 3. I believe corrective wave 4 is already complete and wave 5 down is under way. According to this analysis, wave 5 is subdividing into five subwaves with subwaves (i) and (ii) now complete. This analysis also shows that subwave (iii) down is now under way to be followed by a wave (iv) market correction and a final wave (v) to new lower lows. Once subwave (v) is complete, then that will also complete wave 5 down. Further, once wave 5 is complete, then that will also complete wave (3) down to be followed by waves (4) and (5) (see Figure 1). |
|
| FIGURE 3: S&P 500, HOURLY. This figure shows the developing wave pattern after the completion of subwave 3 as the completion of subwave 4 with subwave 5 under way. Subwave 5 is also subdividing into five smaller waves. This is the preferred analysis as it does not violate any rules as does the symmetrical triangle analysis. |
| Graphic provided by: StockCharts.com. |
| |
| In conclusion, the analysis shows that what looks like a symmetrical triangle may not be one at all. One way we will be able to tell is to watch the direction of the S&P 500 over the next day or two. If the market moves higher, then the pattern is most likely a symmetrical triangle, but if the market continues to move lower, then that will invalidate the formation as a symmetrical triangle. However, this is all academic, as both analyses lead to lower stock prices in the days ahead. |
Alan Northam lives in the Dallas, Texas area and as an electronic engineer gave him an analytical mind from which he has developed a thorough knowledge of stock market technical analysis. His abilities to analyze the future direction of the stock market has allowed him to successfully trade of his own portfolio over the last 30 years. Mr. Northam is now retired and trading the stock market full time. You can reach him at inquiry@tradersclassroom.com or by visiting his website at http://www.tradersclassroom.com. You can also follow him on Twitter @TradersClassrm.
| Garland, Tx | |
| Website: | www.tradersclassroom.com |
| E-mail address: | inquiry@tradersclassroom.com |
Click here for more information about our publications!
Comments
Date:�10/27/08Rank:�5Comment:�
Date:�10/29/08Rank:�5Comment:�

Request Information From Our Sponsors
- StockCharts.com, Inc.
- Candle Patterns
- Candlestick Charting Explained
- Intermarket Technical Analysis
- John Murphy on Chart Analysis
- John Murphy's Chart Pattern Recognition
- John Murphy's Market Message
- MurphyExplainsMarketAnalysis-Intermarket Analysis
- MurphyExplainsMarketAnalysis-Visual Analysis
- StockCharts.com
- Technical Analysis of the Financial Markets
- The Visual Investor
- VectorVest, Inc.
- Executive Premier Workshop
- One-Day Options Course
- OptionsPro
- Retirement Income Workshop
- Sure-Fire Trading Systems (VectorVest, Inc.)
- Trading as a Business Workshop
- VectorVest 7 EOD
- VectorVest 7 RealTime/IntraDay
- VectorVest AutoTester
- VectorVest Educational Services
- VectorVest OnLine
- VectorVest Options Analyzer
- VectorVest ProGraphics v6.0
- VectorVest ProTrader 7
- VectorVest RealTime Derby Tool
- VectorVest Simulator
- VectorVest Variator
- VectorVest Watchdog