HOT TOPICS LIST
- MACD
- Fibonacci
- RSI
- Gann
- ADXR
- Stochastics
- Volume
- Triangles
- Futures
- Cycles
- Volatility
- ZIGZAG
- MESA
- Retracement
- Aroon
INDICATORS LIST
LIST OF TOPICS
PRINT THIS ARTICLE
by Chaitali Mohile
General Electric stock is filled with huge bearish force. The historical support of the stock is under threat in the current downtrend.
Position: Hold
Chaitali Mohile
Active trader in the Indian stock markets since 2003 and a full-time writer. Trading is largely based upon technical analysis.
PRINT THIS ARTICLE
SUPPORT & RESISTANCE
More Downside For GE
10/24/08 01:35:04 PMby Chaitali Mohile
General Electric stock is filled with huge bearish force. The historical support of the stock is under threat in the current downtrend.
Position: Hold
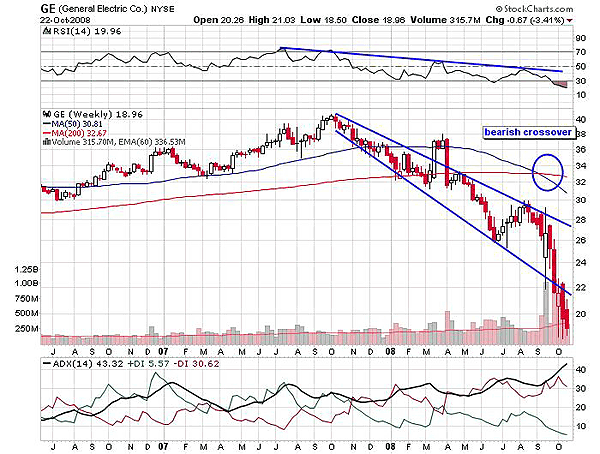
| General Electric (GE) began its downward journey in 2007. The weakness was indicated by the negative divergence on the relative strength index (RSI) (14), and the small candles in Figure 1 formed at the new high. The upper and lower shadows, the doji, and small real bodies are the signs of weakness. The RSI (14) slipped below 50, indicating bearish strength under way. After the 200-day moving average (MA) support was violated, GE declined, forming lower bottoms and lower tops. The developing downtrend indicated by the average directional movement index (ADX) (14) in Figure 1 turned stronger with the declining price. |

|
| FIGURE 1: GE, WEEKLY. The lower trendline support of the falling wedge has been breached and is converted to fresh resistance. Under the bearish pressure, the oversold RSI (14) and the ADX (14) may fail to initiate any bullish rally. |
| Graphic provided by: StockCharts.com. |
| |
| Recently, GE lowered to 18, and the bearish moving average crossover may add to the bearish force (see the marked circle in Figure 1). A bearish crossover, in this case, is the 50-day MA crossing below the 200-day MA. The two trendlines drawn in Figure 1 shows the falling wedge that has broken in a downward direction. Like we all know, the falling wedge is a bullish reversal pattern that begin the fresh bullish rally on an upside breakout. But in Figure 1, we can see that the lower trendline of the wedge is breached. This indicates that the bears are completely charged. The support at 18 and the newly formed trendline resistance may suppress the minor pullback rally. Although the RSI (14) is heavily oversold, and the ADX (14) has reached overheated levels, a fresh upside rally may not begin due to consistent bearish pressure. |

|
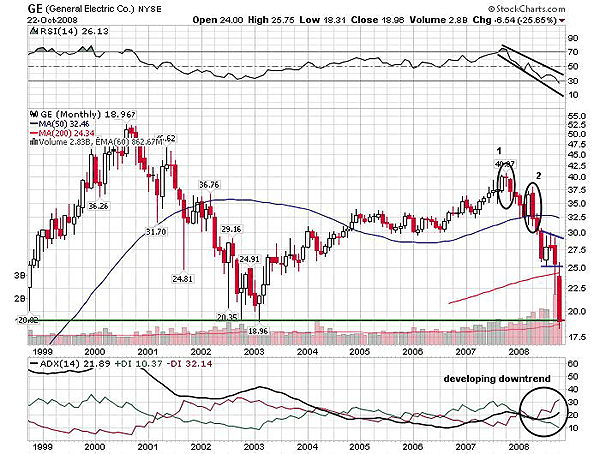
| FIGURE 2: GE, MONTHLY. The chart shows the evening star and the bearish engulfing pattern. The lowest support at 18 is being challenge. |
| Graphic provided by: StockCharts.com. |
| |
| On the monthly chart (Figure 2), the correction that began in 2007 has hit the oldest support approximately at 18. In 2003, the same support was challenged. However, the stock managed to surge establishing support at 18. The rally was interrupted by the evening star candlestick pattern. The evening star is a bearish reversal pattern and gives strong indication of trend change. In Figure 2, we can see two bearish formations marked with numbers. First is the evening star, and second is the bearish engulfing pattern. Thereafter, the stock dropped to 25 levels, and consolidated. This formed a bearish flag & pennant pattern, which has already broken downward. The potential downside for GE can be identified by calculating the target on this bearish formation. We measure the target by subtracting the flagpole length from the breakdown level. Therefore, 37.5 - 25 = 12.5 is the length of flagpole; 25 breakdown level minus 12.5 gives the estimated level of 12.5. |
| Despite the strong historical support at 18, GE can hit the target. In addition, the ADX (14) indicates developing downtrend, and the RSI (14) has marginally moved in oversold territory. This situation will enhance the selling pressure on the stock. Therefore, I would recommend traders to enter fresh short positions at the current level with a target of 12.5, and those already short can ride the bear. |
Active trader in the Indian stock markets since 2003 and a full-time writer. Trading is largely based upon technical analysis.
| Company: | Independent |
| Address: | C1/3 Parth Indraprasth Towers. Vastrapur |
| Ahmedabad, Guj 380015 | |
| E-mail address: | chaitalimohile@yahoo.co.in |
Traders' Resource Links | |
| Independent has not added any product or service information to TRADERS' RESOURCE. | |
Click here for more information about our publications!
Comments
Date: 12/07/08Rank: 5Comment: ...and those who cast their eyes farther to the distant horizon can see indications of a price recovery in the changes to the second and third differentials....

Request Information From Our Sponsors
- StockCharts.com, Inc.
- Candle Patterns
- Candlestick Charting Explained
- Intermarket Technical Analysis
- John Murphy on Chart Analysis
- John Murphy's Chart Pattern Recognition
- John Murphy's Market Message
- MurphyExplainsMarketAnalysis-Intermarket Analysis
- MurphyExplainsMarketAnalysis-Visual Analysis
- StockCharts.com
- Technical Analysis of the Financial Markets
- The Visual Investor
- VectorVest, Inc.
- Executive Premier Workshop
- One-Day Options Course
- OptionsPro
- Retirement Income Workshop
- Sure-Fire Trading Systems (VectorVest, Inc.)
- Trading as a Business Workshop
- VectorVest 7 EOD
- VectorVest 7 RealTime/IntraDay
- VectorVest AutoTester
- VectorVest Educational Services
- VectorVest OnLine
- VectorVest Options Analyzer
- VectorVest ProGraphics v6.0
- VectorVest ProTrader 7
- VectorVest RealTime Derby Tool
- VectorVest Simulator
- VectorVest Variator
- VectorVest Watchdog
