HOT TOPICS LIST
- MACD
- Fibonacci
- RSI
- Gann
- ADXR
- Stochastics
- Volume
- Triangles
- Futures
- Cycles
- Volatility
- ZIGZAG
- MESA
- Retracement
- Aroon
INDICATORS LIST
LIST OF TOPICS
PRINT THIS ARTICLE
by Ron Walker
A three inside down bearish candle pattern formed on the DJIA. Will this reversal pattern take the index lower? A symmetrical triangle may stop sellers dead in their tracks, but if the pattern opens the door to further selling, it may be time to pull the fire alarm again. Should the triangle's trendline be penetrated again, it will attract more shorts who gang up on DIA. The index needs a heralding big tent price revival in order for prices to have a heavenly ascent higher; otherwise, prices will freefall further into a bottomless pit.
Position: N/A
Ron Walker
Ron Walker is an active trader and technical analyst. He operates an educational website dedicated to the study of Technical Analysis. The website offers free market analysis with daily video presentations and written commentaries. Ron is a video pioneer, being one of the first to utilize the internet producing Technical Analysis videos. His website is thechartpatterntrader.com
PRINT THIS ARTICLE
CANDLESTICK CHARTING
DIA Gets Triangular
10/23/08 01:11:19 PMby Ron Walker
A three inside down bearish candle pattern formed on the DJIA. Will this reversal pattern take the index lower? A symmetrical triangle may stop sellers dead in their tracks, but if the pattern opens the door to further selling, it may be time to pull the fire alarm again. Should the triangle's trendline be penetrated again, it will attract more shorts who gang up on DIA. The index needs a heralding big tent price revival in order for prices to have a heavenly ascent higher; otherwise, prices will freefall further into a bottomless pit.
Position: N/A
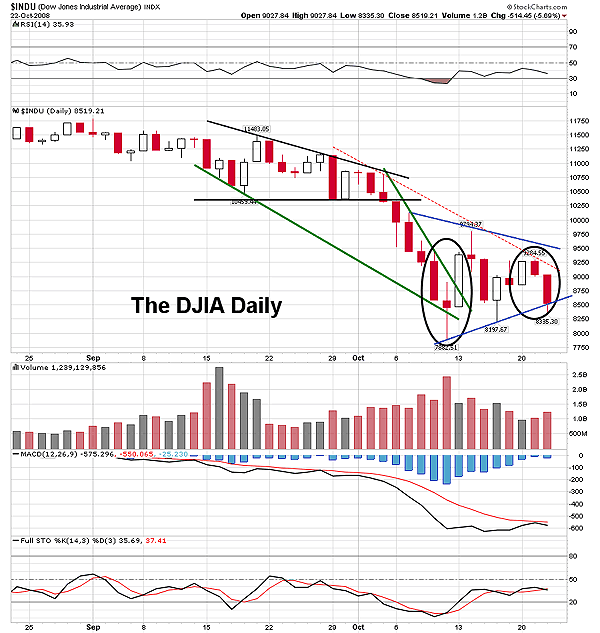
| On October 16, a reversal took place that caused the major indexes to claw their way back up after a powerful plunge that was sinking the market into an abyss. In Figure 1, the Dow Jones Industrial (DJIA), after putting in its largest one-day gain in history of 935.42 points on October 13, reversed course and sold off in a concerted effort to test its most recent minor low. The record rise was part of a three-day candle pattern called a morning star reversal. But due to prices turning south, the candle pattern was never confirmed. Once the October low was successfully tested and held up, prices then found new momentum to bounce off that level of support. They rallied for the next three sessions and then the advance prematurely ended. The DJIA has been the poster child for violent choppy price swings over the past several weeks as investors try to make heads and tails of this economic fiasco. These swings are creating physiological price patterns on the DJIA's electronically traded fund, DIA. |

|
| FIGURE 1: DJIA, DAILY. The DJIA put in a bearish three inside down candle pattern. Prices penetrated the lower boundary of the symmetrical triangle in an intraday push lower. But prices managed to close on the rising trendline, keeping the pattern temporarily in play. |
| Graphic provided by: StockCharts.com. |
| |
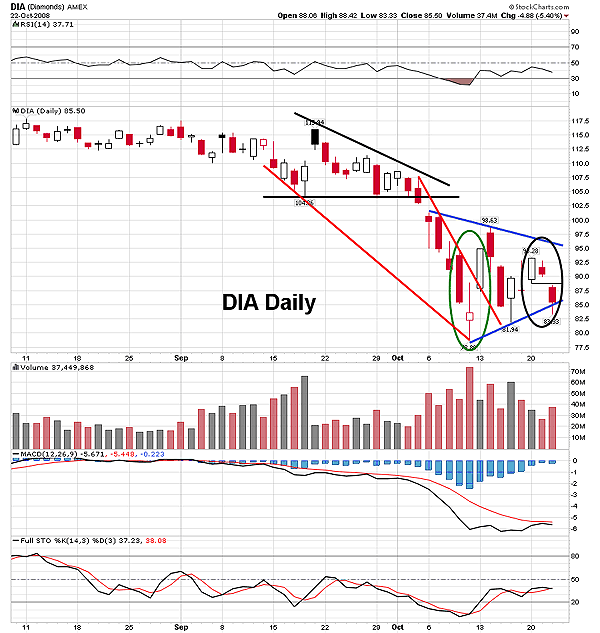
| The electronically traded fund (ETF) that mirrors the DJIA is called the diamonds (DIA). DIA has also been extremely volatile, but during its second recovery a new psychological pattern began to take shape. During this second recovery rally that began on October 16, the DIA began to form a new symmetrical triangle pattern. On October 16, prices began their journey higher but the rally stalled along the way as a bearish two-day candlestick pattern formed on its daily chart, called a bearish harami. In Figure 2, a black oval has been drawn around the entire reversal pattern on DIA. During the first day, a large long white candlestick appeared as the new advance got under way. That is followed by a smaller red candlestick that remains inside the boundaries of the candlestick of the first day, commonly referred to as an inside day. This two-day pattern called the harami is validated once prices drop below the low of the first day's candlestick. In the confirmation process, it becomes a three-day pattern known as a three inside down. Thus, the previous advance is terminated upon confirmation of the harami. The three inside down pattern certainly could give us ample reason to discredit an immediate attempted rally at this point. However, DIA may not be down for the count yet. The volume on the DJIA is contracting on the current selloff, compared to the amount of distribution taking place the second week of October, when the market was in panic mode (Figure 2). |

|
| FIGURE 2: DIAMONDS (DIA), DAILY. The three-day candle pattern circled in green marks the morning star reversal pattern. That pattern failed to get confirmed as prices drifted sides carving out a symmetrical triangle. The three inside down pattern is circled in black. Both patterns occurred within the boundaries of the symmetrical triangle. |
| Graphic provided by: StockCharts.com. |
| |
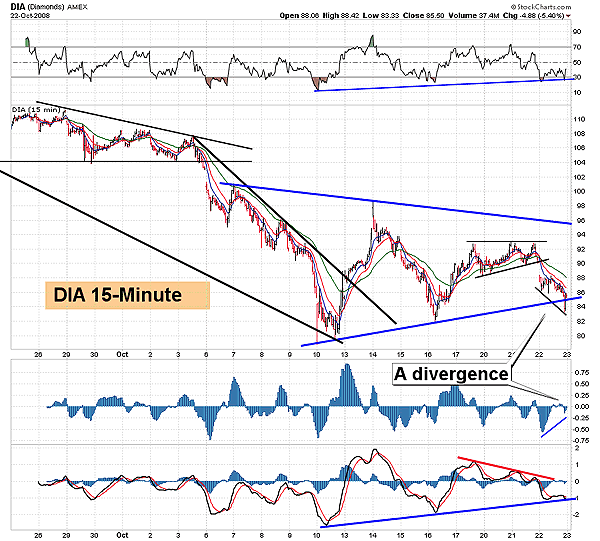
| Since its October 10th low, DIA has been carving out a symmetrical triangle price pattern. During the formation of the bearish harami on the daily chart, DIA formed a small three-day ascending triangle within the symmetrical triangle in the 15-minute time frame (Figure 3). That triangle broke down and sent prices back to test the lower boundary of the larger symmetrical triangle price pattern. Triangle patterns can break either way, but more usually act as continuation patterns. This ascending triangle broke down as prices plummeted and broke through the lower boundary of the larger symmetrical triangle during the intraday low. But they didn't stay there. Prices revived and managed to close on the rising trendline, keeping the larger symmetrical triangle still in the game. |

|
| FIGURE 1: DIAMONDS (DIA), 15-MINUTE. Here we see the smaller ascending triangle pattern that failed in a larger symmetrical triangle. Note how the MACD and the RSI are testing their trendlines. There is a small divergence between the MACD histogram and price, suggesting the trend may hold in spite of the three inside down candle pattern on its daily chart. Prices evolved from a bearish descending triangle to a falling wedge, emerging into a symmetrical triangle. |
| Graphic provided by: StockCharts.com. |
| |
| Both the moving average convergence/divergence (MACD) and the relative strength index (RSI) are resting on the their rising trendlines as DIA seeks to balance itself on this tightrope of trendline. Should prices bounce here, they will rise to attempt another test at the upper boundary of the symmetrical triangle. If prices lose their footing, DIA will fall and the triangle will be decisively broken. If the triangle is penetrated and stumble here, DIA will nosedive to test the October 10th lows, which will likely act as a safety net and contain selling pressure. |
| Prices did puncture the trendline with its intraday push lower, but this may have been an attempt at a shakeout. Shakeouts often occur at reliable horizontal and rising trendlines. Despite the fact that the rising trendline had an intraday violation, DIA still is maintaining a higher low. The symmetrical triangle has carved out lower highs but higher lows. This represents a battle of bulls and bears, fighting for the control of DIA's future direction. In trending markets and rangebound markets, we must ploy different trading techniques offering low-risk entry and exit strategies. These violent price swings that are occurring have created a wonderful day/swing trading environment, and trend traders will likely get weary until trend-following indicators give a valid signal that a new trend has formed. Prices are moving so fast right now yielding huge percentage swings, a trader should take a proactive posture by buying support and selling resistance. Those who have positioned themselves for a long-term hold must be patient with gut-wrenching price swings. |
Ron Walker is an active trader and technical analyst. He operates an educational website dedicated to the study of Technical Analysis. The website offers free market analysis with daily video presentations and written commentaries. Ron is a video pioneer, being one of the first to utilize the internet producing Technical Analysis videos. His website is thechartpatterntrader.com
| Website: | thechartpatterntrader.com |
| E-mail address: | thechartpatterntrader@gmail.com |
Click here for more information about our publications!
PRINT THIS ARTICLE

Request Information From Our Sponsors
- VectorVest, Inc.
- Executive Premier Workshop
- One-Day Options Course
- OptionsPro
- Retirement Income Workshop
- Sure-Fire Trading Systems (VectorVest, Inc.)
- Trading as a Business Workshop
- VectorVest 7 EOD
- VectorVest 7 RealTime/IntraDay
- VectorVest AutoTester
- VectorVest Educational Services
- VectorVest OnLine
- VectorVest Options Analyzer
- VectorVest ProGraphics v6.0
- VectorVest ProTrader 7
- VectorVest RealTime Derby Tool
- VectorVest Simulator
- VectorVest Variator
- VectorVest Watchdog
- StockCharts.com, Inc.
- Candle Patterns
- Candlestick Charting Explained
- Intermarket Technical Analysis
- John Murphy on Chart Analysis
- John Murphy's Chart Pattern Recognition
- John Murphy's Market Message
- MurphyExplainsMarketAnalysis-Intermarket Analysis
- MurphyExplainsMarketAnalysis-Visual Analysis
- StockCharts.com
- Technical Analysis of the Financial Markets
- The Visual Investor
