

HOT TOPICS LIST
- MACD
- Fibonacci
- RSI
- Gann
- ADXR
- Stochastics
- Volume
- Triangles
- Futures
- Cycles
- Volatility
- ZIGZAG
- MESA
- Retracement
- Aroon
INDICATORS LIST
LIST OF TOPICS
PRINT THIS ARTICLE
by Alan R. Northam
XLF is close to completing an ABC zigzag market correction. Will it mark the bottom for the financial sector or if it is simply a part of a much larger market correction?
Position: N/A
Alan R. Northam
Alan Northam lives in the Dallas, Texas area and as an electronic engineer gave him an analytical mind from which he has developed a thorough knowledge of stock market technical analysis. His abilities to analyze the future direction of the stock market has allowed him to successfully trade of his own portfolio over the last 30 years. Mr. Northam is now retired and trading the stock market full time. You can reach him at inquiry@tradersclassroom.com or by visiting his website at http://www.tradersclassroom.com. You can also follow him on Twitter @TradersClassrm.
PRINT THIS ARTICLE
ELLIOTT WAVE
Financial Select SPDR Bottom?
10/22/08 09:47:24 AMby Alan R. Northam
XLF is close to completing an ABC zigzag market correction. Will it mark the bottom for the financial sector or if it is simply a part of a much larger market correction?
Position: N/A
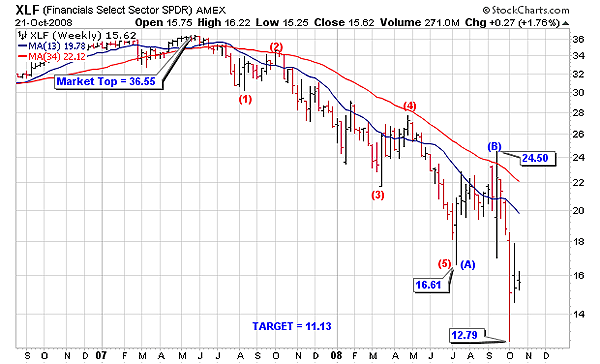
| According to Elliott wave theory, once a market makes a major market top, that market will correct in three waves. These three waves have been defined by Elliott wave as an ABC zigzag. In the case where the market made a major bull market top, an ABC zigzag unfolds as five waves down forming wave A, three waves up forming wave B, followed by a final five waves down that forms wave C. Upon completion of the ABC zigzag correction, Elliott further states that a new market trend will develop in the opposite direction of the ABC zigzag. |
| Figure 1 shows the weekly bar chart of the Financial Select SPDR (XLF). This chart shows that XLF made a major bull market top in May 2007. Since that time, XLF has unfolded in five nonoverlapping waves, forming wave A, obeying all the rules of the Elliott wave theory. In addition to completing wave A of an ABC zigzag, XLF has also completed wave B. This leaves the final wave C to complete the ABC zigzag. With wave B complete, wave C is now under way. To calculate a high-probability price target for the completion of wave C, divide the price at the market top (36.55) from the price minimum at the completion of wave A (16.61). Then subtract this quotient from the price maximum of wave B (24.50) to arrive at a price target of $11.13 for the completion of wave C. |
| Elliott waves have a tendency sometimes to alternate. In the case of an ABC zigzag, what this means is that sometimes if wave A unfolds slowly, then wave C may develop quickly. This appears to be the case with the ABC zigzag corrective formation for XLF. Two weeks ago, XLF closed in on our price target for the completion of wave C, when the market dipped down to 12.79. This is an indication that the final five waves of our ABC zigzag corrective pattern are unfolding quickly. In these cases, it is sometimes not easy to see these final five waves without going to a smaller time frame. |
|
| FIGURE 1: XLF, WEEKLY. Since the major bull market top in May 2007, XLF has unfolded in five nonoverlapping waves. |
| Graphic provided by: StockCharts.com. |
| |
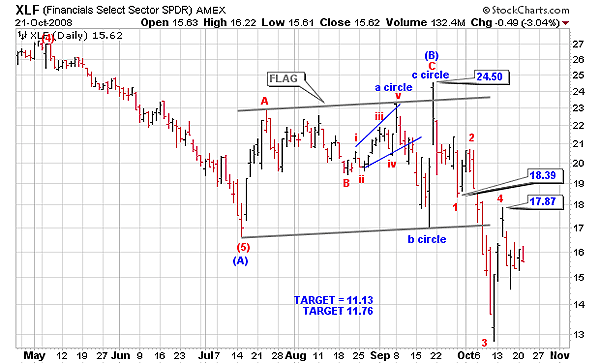
| Figure 2 shows the daily bar chart of XLF. This chart shows that wave C has unfolded in four waves — waves 1, 2, 3, and 4, with wave 5 yet to be completed. There is some possibility that wave 4 is not yet complete and that it could be in the early stage of developing into a triangle pattern. However, that possibility is still unclear, so I will stick with wave 4 being completed at 17.87 until proven otherwise. With wave 4 completed, the final fifth wave is currently unfolding. To calculate a high-probability price target for the completion of wave 5, take the maximum price of wave B (24.50) and subtract the minimum price of wave 1 (18.39) from it. Take this difference and subtract it from the price maximum of wave 4 (17.87) to arrive at a target price of 11.76. Note that this is slightly different from our previous calculation of 11.13. This is known as a price cluster. A price cluster is a range of prices for the same target price that has been derived by various methods. A price cluster is a higher-probability target price than a single calculated price target. Therefore, expect wave C to be complete somewhere in the price range of between 11.76 and 11.13. |
|
| FIGURE 2: XLF, DAILY. Wave C has unfolded in four waves. |
| Graphic provided by: StockCharts.com. |
| |
| In conclusion, we have looked at the selloff of XLF from the market top of May 2007 as an ABC zigzag market correction with a high probability of wave C being completed in the price range of 11.76 and 11.13. If this price target is in fact the bottom of the market correction for XLF, then a five-wave advance will follow. These five waves will then signal that the market correction is over and a new bull market trend is developing. However, if a three-wave advance follows the completion of wave C, it will signal the correction for XLF is not over and a much larger ABC market correction is still in progress. So the wave structure following the completion of wave C is very important to identify, as it will tell us if XLF is going to move higher or lower in the future. |
Alan Northam lives in the Dallas, Texas area and as an electronic engineer gave him an analytical mind from which he has developed a thorough knowledge of stock market technical analysis. His abilities to analyze the future direction of the stock market has allowed him to successfully trade of his own portfolio over the last 30 years. Mr. Northam is now retired and trading the stock market full time. You can reach him at inquiry@tradersclassroom.com or by visiting his website at http://www.tradersclassroom.com. You can also follow him on Twitter @TradersClassrm.
| Garland, Tx | |
| Website: | www.tradersclassroom.com |
| E-mail address: | inquiry@tradersclassroom.com |
Click here for more information about our publications!
PRINT THIS ARTICLE

Request Information From Our Sponsors
- StockCharts.com, Inc.
- Candle Patterns
- Candlestick Charting Explained
- Intermarket Technical Analysis
- John Murphy on Chart Analysis
- John Murphy's Chart Pattern Recognition
- John Murphy's Market Message
- MurphyExplainsMarketAnalysis-Intermarket Analysis
- MurphyExplainsMarketAnalysis-Visual Analysis
- StockCharts.com
- Technical Analysis of the Financial Markets
- The Visual Investor
- VectorVest, Inc.
- Executive Premier Workshop
- One-Day Options Course
- OptionsPro
- Retirement Income Workshop
- Sure-Fire Trading Systems (VectorVest, Inc.)
- Trading as a Business Workshop
- VectorVest 7 EOD
- VectorVest 7 RealTime/IntraDay
- VectorVest AutoTester
- VectorVest Educational Services
- VectorVest OnLine
- VectorVest Options Analyzer
- VectorVest ProGraphics v6.0
- VectorVest ProTrader 7
- VectorVest RealTime Derby Tool
- VectorVest Simulator
- VectorVest Variator
- VectorVest Watchdog