HOT TOPICS LIST
- MACD
- Fibonacci
- RSI
- Gann
- ADXR
- Stochastics
- Volume
- Triangles
- Futures
- Cycles
- Volatility
- ZIGZAG
- MESA
- Retracement
- Aroon
INDICATORS LIST
LIST OF TOPICS
PRINT THIS ARTICLE
by Chaitali Mohile
The Canada iShares has declined nearly 50% under bearish conditions. The weakness may drag the ETF much lower.
Position: N/A
Chaitali Mohile
Active trader in the Indian stock markets since 2003 and a full-time writer. Trading is largely based upon technical analysis.
PRINT THIS ARTICLE
TECHNICAL INDICATORS
EWC Lacks Strength
10/22/08 11:21:37 AMby Chaitali Mohile
The Canada iShares has declined nearly 50% under bearish conditions. The weakness may drag the ETF much lower.
Position: N/A
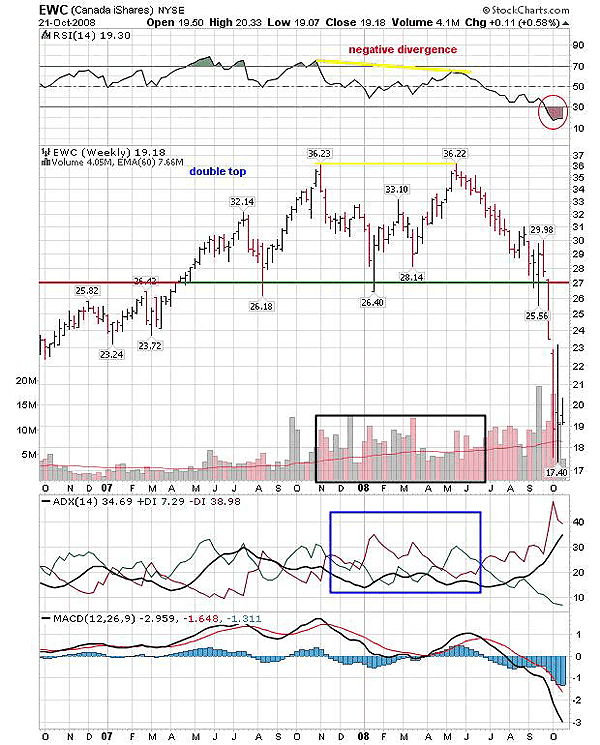
| The Canada iShares (EWC) has been rallying successfully since April 2007 with a support level at 27. This support level was retested three times during the bullish rally. The stock retraced to the support after every new high -- that is, 32.14 and 36.23. In Figure 1, the average directional movement index (ADX) (14) witnessed a tough fight between the sellers and buyers, and thereafter, the trend changed frequently. In addition, the moving average convergence/divergence (MACD) (12,26,9) was highly volatile in positive territory. But the bullish strength was reflected only by the relative strength index (RSI) (14) as the oscillator sustained above the golden support at 50. The RSI (14) declined from the overbought area, but established support at 50 and rallied back to its bullish zone. So the consistent strength to pull EWC higher was lacking. |
| At 36.23, EWC plunged to 27, its support level, due to a sudden flow of selling pressure, indicated by the negative directional index (-DI). The RSI (14) also retraced to 50 but bounced immediately to the overbought level. EWC rallied as well to the previous high. The technical patterns formed on Figure 1 were not healthy. The RSI (14) showed negative divergence, and the price chart formed a double top. Both indications were highly bearish. The ADX (14) moved in favor of the bears with robust selling pressure. The volatile volume suddenly dropped as the double top was formed. All three indicators were captured by bearish strength, and therefore, EWC breached the historical support of 27. The slump continued, and the stock hit the lowest level at 17. |

|
| FIGURE 1: EWC, WEEKLY. Note the bearish indicators above the bar chart. The oversold RSI (14) may not attract fresh buying. |
| Graphic provided by: StockCharts.com. |
| |
| EWC is engulfed by a bearish force after correcting almost 20 points from the top. The RSI (14) is the only indicator that shows the possibility of a pullback rally from the current level. But EWC has always lacked the bullish strength and support from all the three indicators together. The same reason would discourage any pullback from the support at 17. In the past three weeks, the stock has not moved below this level, so we can anticipate a temporary support being established at 17. The ADX (14) indicates a well-developed downtrend, and the MACD (12,26,9) is negative, so both indicators are highly bearish. I would also like to highlight that the oversold RSI (14) may stay in this zone for a long period as well. |
| Currently, support at 17 may be held, but indicators on the chart indicate weakness. Therefore, lack of strength may keep EWC volatile and it may even decline below 17. |
Active trader in the Indian stock markets since 2003 and a full-time writer. Trading is largely based upon technical analysis.
| Company: | Independent |
| Address: | C1/3 Parth Indraprasth Towers. Vastrapur |
| Ahmedabad, Guj 380015 | |
| E-mail address: | chaitalimohile@yahoo.co.in |
Traders' Resource Links | |
| Independent has not added any product or service information to TRADERS' RESOURCE. | |
Click here for more information about our publications!
PRINT THIS ARTICLE

Request Information From Our Sponsors
- VectorVest, Inc.
- Executive Premier Workshop
- One-Day Options Course
- OptionsPro
- Retirement Income Workshop
- Sure-Fire Trading Systems (VectorVest, Inc.)
- Trading as a Business Workshop
- VectorVest 7 EOD
- VectorVest 7 RealTime/IntraDay
- VectorVest AutoTester
- VectorVest Educational Services
- VectorVest OnLine
- VectorVest Options Analyzer
- VectorVest ProGraphics v6.0
- VectorVest ProTrader 7
- VectorVest RealTime Derby Tool
- VectorVest Simulator
- VectorVest Variator
- VectorVest Watchdog
- StockCharts.com, Inc.
- Candle Patterns
- Candlestick Charting Explained
- Intermarket Technical Analysis
- John Murphy on Chart Analysis
- John Murphy's Chart Pattern Recognition
- John Murphy's Market Message
- MurphyExplainsMarketAnalysis-Intermarket Analysis
- MurphyExplainsMarketAnalysis-Visual Analysis
- StockCharts.com
- Technical Analysis of the Financial Markets
- The Visual Investor
