HOT TOPICS LIST
- MACD
- Fibonacci
- RSI
- Gann
- ADXR
- Stochastics
- Volume
- Triangles
- Futures
- Cycles
- Volatility
- ZIGZAG
- MESA
- Retracement
- Aroon
INDICATORS LIST
LIST OF TOPICS
PRINT THIS ARTICLE
by James Kupfer
QCOM has been in a channel since 2005, so is now the right time to buy?
Position: Buy
James Kupfer
Mr. Kupfer is a market professional and amateur stock market commentator. Disclosure: It is likely that Mr. Kupfer has or will enter a position in any security he writes about.
PRINT THIS ARTICLE
CHANNEL LINES
Qualcomm's Channeling
10/22/08 10:43:05 AMby James Kupfer
QCOM has been in a channel since 2005, so is now the right time to buy?
Position: Buy
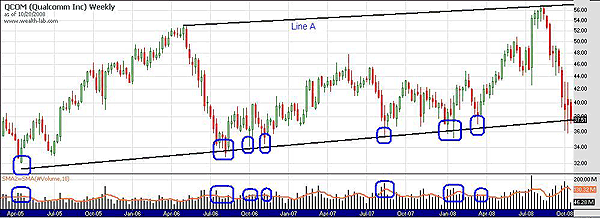
| Figure 1 is a weekly chart of Qualcomm, starting in March 2005. Visually, it looks like a channel has formed, but the bottom part of the channel can be hard to discern since there is no uniform distribution of lows or closes. There is, however, a simple technique to help form the bottom line and create a complete channel. |

|
| FIGURE 1: QCOM, WEEKLY. Where's the bottom channel? |
| Graphic provided by: Wealth-lab. |
| |
| Take a simple trendline formed by connecting the May 2006 top and the August 2008 top. I have labeled this "line A." Many, if not most, charting software packages will allow you to duplicate that original line and reposition the copy. I have used that same process to create the bottom channel line in black. In this case, positioning the copied channel line is more art form than science, and you can see that I placed it where it was reasonably close to a significant amount of price action. |
| The bottom channel line has been formed by eight prior touches, circled in blue. Immediately below each of the touches I also circled the volume. In most cases, each touch was accompanied by higher than average volume, lending credence to the value of the touch. The price action of the last three weeks has brought QCOM to the same level as the trend channel, which could again provide support and will hopefully prevent the stock from moving any lower. |
| If the channel holds, QCOM could again see $46-48 in the near to intermediate term. Stops should, of course, be placed generally below the current October or even January 2008 lows. |
Mr. Kupfer is a market professional and amateur stock market commentator. Disclosure: It is likely that Mr. Kupfer has or will enter a position in any security he writes about.
Click here for more information about our publications!
PRINT THIS ARTICLE

Request Information From Our Sponsors
- StockCharts.com, Inc.
- Candle Patterns
- Candlestick Charting Explained
- Intermarket Technical Analysis
- John Murphy on Chart Analysis
- John Murphy's Chart Pattern Recognition
- John Murphy's Market Message
- MurphyExplainsMarketAnalysis-Intermarket Analysis
- MurphyExplainsMarketAnalysis-Visual Analysis
- StockCharts.com
- Technical Analysis of the Financial Markets
- The Visual Investor
- VectorVest, Inc.
- Executive Premier Workshop
- One-Day Options Course
- OptionsPro
- Retirement Income Workshop
- Sure-Fire Trading Systems (VectorVest, Inc.)
- Trading as a Business Workshop
- VectorVest 7 EOD
- VectorVest 7 RealTime/IntraDay
- VectorVest AutoTester
- VectorVest Educational Services
- VectorVest OnLine
- VectorVest Options Analyzer
- VectorVest ProGraphics v6.0
- VectorVest ProTrader 7
- VectorVest RealTime Derby Tool
- VectorVest Simulator
- VectorVest Variator
- VectorVest Watchdog
