HOT TOPICS LIST
- MACD
- Fibonacci
- RSI
- Gann
- ADXR
- Stochastics
- Volume
- Triangles
- Futures
- Cycles
- Volatility
- ZIGZAG
- MESA
- Retracement
- Aroon
INDICATORS LIST
LIST OF TOPICS
PRINT THIS ARTICLE
by Chaitali Mohile
The Industrial Select Sector SPDR has hit the target, and the momentum indicators are oversold. Is the situation favorable for a successful bounce?
Position: N/A
Chaitali Mohile
Active trader in the Indian stock markets since 2003 and a full-time writer. Trading is largely based upon technical analysis.
PRINT THIS ARTICLE
TECHNICAL ANALYSIS
XLI Ready To Bounce
10/21/08 11:23:56 AMby Chaitali Mohile
The Industrial Select Sector SPDR has hit the target, and the momentum indicators are oversold. Is the situation favorable for a successful bounce?
Position: N/A
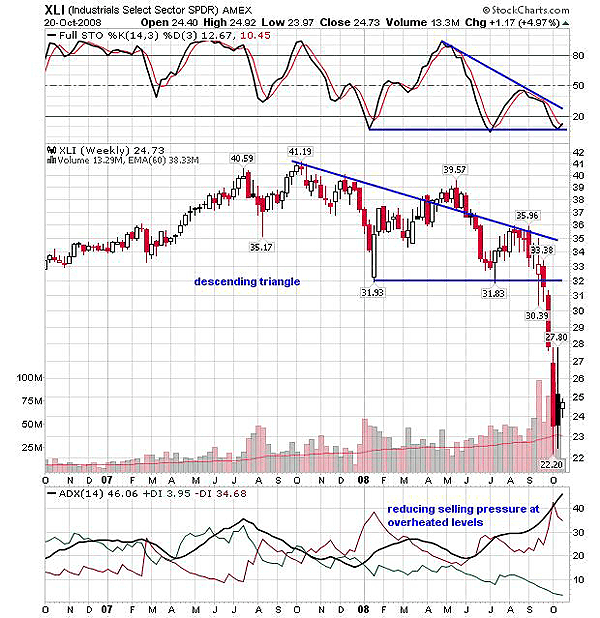
| The Industrial Select Sector SPDR (XLI) showed a major trend reversal by forming a descending triangle at the highs. This pattern is generally seen as a continuation pattern in a downtrend, but in an uptrend, the triangle is considered to be a reversal pattern. The weekly chart (Figure 1) shows 41.19 as the new high of XLI, and the series of lower highs followed, indicating uncertainty and lack of strength. However, the bottom of the triangle is flat. The double top formed by stochastic (14,3,3) resulted in the series of lower peaks. Along with the price chart, the oscillator also formed a descending triangle. Thus, both triangles narrowed further, and soon XLI broke off in a downward direction. With the breakout, the developing downtrend turned stronger with high selling pressure. The average directional movement index (ADX) (14) moved above 30, indicating a developing downtrend. |

|
| FIGURE 1: XLI, WEEKLY. The stock has reached the target on a descending triangle breakout. The support is likely to be established at 23. |
| Graphic provided by: StockCharts.com. |
| |
| The minimum estimated level on the descending triangle is usually calculated by subtracting the length of triangle from the breakout level. Therefore, 41.19 - 31.93 = 9.26 is the length, and 32 (breakout) - 9.26 = 22.74 is the target. In Figure 1, we can see XLI has hit the target and further moved down to 22.20. The stock is likely to establish support at 23, because the stochastic (14,3,3) is highly oversold at 20 and is ready to surge. The ADX (14) is heavily overheated at 46, and the negative directional index (-DI) shows reducing selling pressure, so the downtrend might cool off a bit. This situation can initiate a bullish rally. |

|
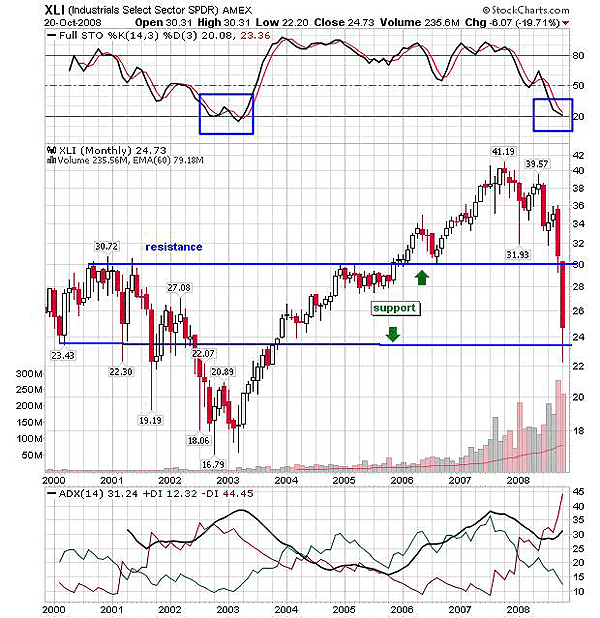
| FIGURE 2: XLI, MONTHLY. XLI may move in a tight range of support and resistance at 30 and 23 levels. |
| Graphic provided by: StockCharts.com. |
| |
| In Figure 2, we can see a resistance line at a 30.72 level that was turned to support in 2006, and the ADX (14) was gradually captured by the bulls. The uptrend turned stronger as XLI rallied higher. The chart also shows that the stochastic (14,3,3) marginally rested on oversold levels and surged. Therefore, 20 would be seen as a robust support on the indicator. |
| XLI slipped from the all-time high of 41.19 and never recovered. The previous resistance (30.72) converted to support was violated. In the current month, XLI is likely to move within support-resistance levels at 30 and 23, respectively. The stochastic (14,3,3) is back to the support at 20 level (see Figure 2). Although the downtrend is developed, with reducing selling pressure and the oversold stochastic (14,3,3) may give birth to a rally with the help of a support line. Both the lines in Figure 2 would keep a tight range, and it would be highly difficult for XLI to surge above the resistance line at 30 in current volatility. |
| Therefore, the scenario suggests the possibility of a temporary bounce in XLI. |
Active trader in the Indian stock markets since 2003 and a full-time writer. Trading is largely based upon technical analysis.
| Company: | Independent |
| Address: | C1/3 Parth Indraprasth Towers. Vastrapur |
| Ahmedabad, Guj 380015 | |
| E-mail address: | chaitalimohile@yahoo.co.in |
Traders' Resource Links | |
| Independent has not added any product or service information to TRADERS' RESOURCE. | |
Click here for more information about our publications!
PRINT THIS ARTICLE

Request Information From Our Sponsors
- StockCharts.com, Inc.
- Candle Patterns
- Candlestick Charting Explained
- Intermarket Technical Analysis
- John Murphy on Chart Analysis
- John Murphy's Chart Pattern Recognition
- John Murphy's Market Message
- MurphyExplainsMarketAnalysis-Intermarket Analysis
- MurphyExplainsMarketAnalysis-Visual Analysis
- StockCharts.com
- Technical Analysis of the Financial Markets
- The Visual Investor
- VectorVest, Inc.
- Executive Premier Workshop
- One-Day Options Course
- OptionsPro
- Retirement Income Workshop
- Sure-Fire Trading Systems (VectorVest, Inc.)
- Trading as a Business Workshop
- VectorVest 7 EOD
- VectorVest 7 RealTime/IntraDay
- VectorVest AutoTester
- VectorVest Educational Services
- VectorVest OnLine
- VectorVest Options Analyzer
- VectorVest ProGraphics v6.0
- VectorVest ProTrader 7
- VectorVest RealTime Derby Tool
- VectorVest Simulator
- VectorVest Variator
- VectorVest Watchdog
