HOT TOPICS LIST
- MACD
- Fibonacci
- RSI
- Gann
- ADXR
- Stochastics
- Volume
- Triangles
- Futures
- Cycles
- Volatility
- ZIGZAG
- MESA
- Retracement
- Aroon
INDICATORS LIST
LIST OF TOPICS
PRINT THIS ARTICLE
by Koos van der Merwe
It could be either, but when does Warren Buffett start buying?
Position: Buy
Koos van der Merwe
Has been a technical analyst since 1969, and has worked as a futures and options trader with First Financial Futures in Johannesburg, South Africa.
PRINT THIS ARTICLE
ELLIOTT WAVE
October 2008 Or October 2009?
10/20/08 09:50:08 AMby Koos van der Merwe
It could be either, but when does Warren Buffett start buying?
Position: Buy
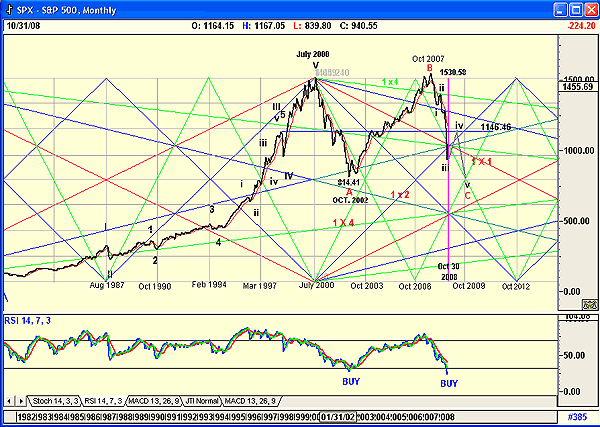
| The world economy is collapsing around us, with the United States leading the way. The last two weeks have been the most volatile in stock market history, with plummets in the indexes breaking all previous records. The worst financial crisis since the Great Depression is redrawing the boundaries between government and the markets. The stock market crash of October 1929 took over three years for the US government to launch a series of dramatic efforts to end the Depression, starting with Franklin Roosevelt's declaration of a four-day bank holiday in March 1933. The Depression wreaked enormous damage across the globe, and in Europe led to the rise of Adolf Hitler as he won Germany by taking the country out of its economic misery and leading them into World War II -- even more misery. The landscape of US finance has been radically changed. In little more than three weeks, the American government expanded gross liabilities by more than $1 trillion -- almost twice as much as the cost so far of the Iraq war. In Europe we have seen five European banks fail, with European governments falling over themselves to prop up their banking systems. What will the long-term effect of this mess on the global economy be? Another Hitler? And then there is Asia, but that is another story. Figure 1 is a monthly chart of the Standard & Poor's 500. Will this chart tell us when or where the end is in sight? Remarkably enough, yes -- but for the US to be followed by Europe and a very changed world -- that is political, not economic. |

|
| FIGURE 1: S&P 500, GANN CHART |
| Graphic provided by: AdvancedGET. |
| |
| As you can see, the relative strength index (RSI) is oversold, and from looking at previous oversold positions, in bear markets (past tense), markets reacted in an up move, then a retest of the low before a new bull market started. Note too the date, October 2002. So what is it with October, and is it going to repeat itself? The chart says decisively yes. Unfortunately, Elliott wave theory teaches us that C-waves fall in a five-wave pattern. On the chart I have shown where I expect the correction upward to end, 1146, because this level has acted as a strong resistance/support level in the past. The fall into wave 5 of wave C is a retest of the low of October 2002 at 814.41. Whether this will actually occur is debatable, but without any doubt, an up move and down move correction after the up move is on the cards, and the timing is October. So, yes, the market will correct upward, in October. Whether October 2008 or October 2009 is the start of a new bull market, that is the question. |
Has been a technical analyst since 1969, and has worked as a futures and options trader with First Financial Futures in Johannesburg, South Africa.
| Address: | 3256 West 24th Ave |
| Vancouver, BC | |
| Phone # for sales: | 6042634214 |
| E-mail address: | petroosp@gmail.com |
Click here for more information about our publications!
Comments
Date: 10/21/08Rank: 5Comment:
Date: 10/27/08Rank: 5Comment:

Request Information From Our Sponsors
- StockCharts.com, Inc.
- Candle Patterns
- Candlestick Charting Explained
- Intermarket Technical Analysis
- John Murphy on Chart Analysis
- John Murphy's Chart Pattern Recognition
- John Murphy's Market Message
- MurphyExplainsMarketAnalysis-Intermarket Analysis
- MurphyExplainsMarketAnalysis-Visual Analysis
- StockCharts.com
- Technical Analysis of the Financial Markets
- The Visual Investor
- VectorVest, Inc.
- Executive Premier Workshop
- One-Day Options Course
- OptionsPro
- Retirement Income Workshop
- Sure-Fire Trading Systems (VectorVest, Inc.)
- Trading as a Business Workshop
- VectorVest 7 EOD
- VectorVest 7 RealTime/IntraDay
- VectorVest AutoTester
- VectorVest Educational Services
- VectorVest OnLine
- VectorVest Options Analyzer
- VectorVest ProGraphics v6.0
- VectorVest ProTrader 7
- VectorVest RealTime Derby Tool
- VectorVest Simulator
- VectorVest Variator
- VectorVest Watchdog
