HOT TOPICS LIST
- MACD
- Fibonacci
- RSI
- Gann
- ADXR
- Stochastics
- Volume
- Triangles
- Futures
- Cycles
- Volatility
- ZIGZAG
- MESA
- Retracement
- Aroon
INDICATORS LIST
LIST OF TOPICS
PRINT THIS ARTICLE
by Arthur Hill
Relative strength, good volume, and a potential double bottom point to higher prices for Skywest.
Position: Accumulate
Arthur Hill
Arthur Hill is currently editor of TDTrader.com, a website specializing in trading strategies, sector/industry specific breadth stats and overall technical analysis. He passed the Society of Technical Analysts (STA London) diploma exam with distinction is a Certified Financial Technician (CFTe). Prior to TD Trader, he was the Chief Technical Analyst for Stockcharts.com and the main contributor to the ChartSchool.
PRINT THIS ARTICLE
DOUBLE BOTTOMS
Skywest Poised For Takeoff?
10/17/08 09:20:42 AMby Arthur Hill
Relative strength, good volume, and a potential double bottom point to higher prices for Skywest.
Position: Accumulate
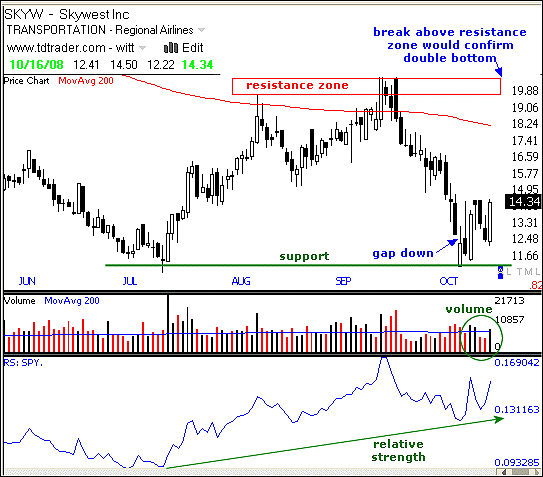
| Skywest (SKYW) declined sharply with the rest of the market in September but found support from its summer lows in early October. The stock firmed after a gap down and then bounced with above-average volume three of the last five days. This bounce reinforces support from the prior low and opens the door to a possible double bottom. The August–September highs mark double-bottom resistance and a break above these levels is needed for confirmation. |

|
| FIGURE 1: SKYW, MONTHLY. SKYW dropped with the rest of the market in September but found support from its summer lows in early October. |
| Graphic provided by: TeleChart2007. |
| |
| SKYW is stronger than the overall market, and this helps the bullish case. The bottom indicator shows the price relative, which compares Skywest to the S&P 500 exchange traded fund (ETF) (SPY). While the stock tested support from the summer lows, the price relative held well above its summer lows, and this shows relative strength. In contrast to SKYW, SPY broke well below its summer lows in September–October and SKYW held up much better. The price relative turned up over the last six days and the stock could be set to reestablish its leadership role. |

|
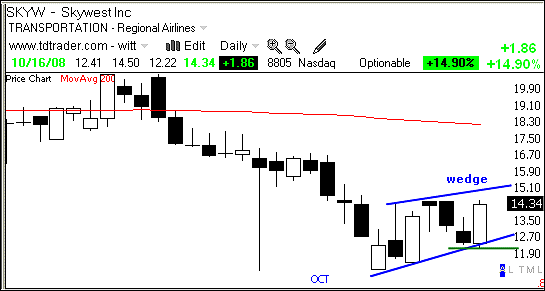
| FIGURE 2: SKYW, DAILY. This short-term picture of the stock over five weeks shows the sharp decline and the bounce, which looks like a small rising wedge. |
| Graphic provided by: TeleChart2007. |
| |
| Figure 2 shows a short-term picture with Skywest over the last five weeks. This captures the sharp decline and the bounce, which looks like a small rising wedge. The bulls have the edge as long as the wedge rises. In addition, a strong stock should hold its bounce off support and never look back. With a long white candlestick on October 16, SKYW established support around 12. A move below this level would break wedge support and call for a continuation of the prior decline. Needless to say, this would also question the potential double bottom and call for a reevaluation. |
Arthur Hill is currently editor of TDTrader.com, a website specializing in trading strategies, sector/industry specific breadth stats and overall technical analysis. He passed the Society of Technical Analysts (STA London) diploma exam with distinction is a Certified Financial Technician (CFTe). Prior to TD Trader, he was the Chief Technical Analyst for Stockcharts.com and the main contributor to the ChartSchool.
| Title: | Editor |
| Company: | TDTrader.com |
| Address: | Willem Geetsstraat 17 |
| Mechelen, B2800 | |
| Phone # for sales: | 3215345465 |
| Website: | www.tdtrader.com |
| E-mail address: | arthurh@tdtrader.com |
Traders' Resource Links | |
| TDTrader.com has not added any product or service information to TRADERS' RESOURCE. | |
Click here for more information about our publications!
PRINT THIS ARTICLE

|

Request Information From Our Sponsors
- StockCharts.com, Inc.
- Candle Patterns
- Candlestick Charting Explained
- Intermarket Technical Analysis
- John Murphy on Chart Analysis
- John Murphy's Chart Pattern Recognition
- John Murphy's Market Message
- MurphyExplainsMarketAnalysis-Intermarket Analysis
- MurphyExplainsMarketAnalysis-Visual Analysis
- StockCharts.com
- Technical Analysis of the Financial Markets
- The Visual Investor
- VectorVest, Inc.
- Executive Premier Workshop
- One-Day Options Course
- OptionsPro
- Retirement Income Workshop
- Sure-Fire Trading Systems (VectorVest, Inc.)
- Trading as a Business Workshop
- VectorVest 7 EOD
- VectorVest 7 RealTime/IntraDay
- VectorVest AutoTester
- VectorVest Educational Services
- VectorVest OnLine
- VectorVest Options Analyzer
- VectorVest ProGraphics v6.0
- VectorVest ProTrader 7
- VectorVest RealTime Derby Tool
- VectorVest Simulator
- VectorVest Variator
- VectorVest Watchdog
