HOT TOPICS LIST
- MACD
- Fibonacci
- RSI
- Gann
- ADXR
- Stochastics
- Volume
- Triangles
- Futures
- Cycles
- Volatility
- ZIGZAG
- MESA
- Retracement
- Aroon
INDICATORS LIST
LIST OF TOPICS
PRINT THIS ARTICLE
by Chaitali Mohile
Apple Inc. is heading toward the lowest support. Can the stock form a bottom?
Position: Sell
Chaitali Mohile
Active trader in the Indian stock markets since 2003 and a full-time writer. Trading is largely based upon technical analysis.
PRINT THIS ARTICLE
CHART ANALYSIS
Apple Near Support
10/17/08 09:14:14 AMby Chaitali Mohile
Apple Inc. is heading toward the lowest support. Can the stock form a bottom?
Position: Sell
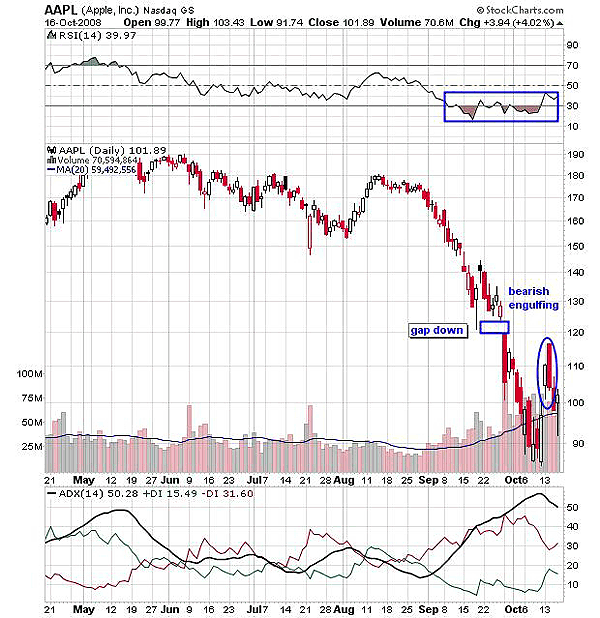
| Forming lower lows at the new highs is not a healthy sign for any stock or index. In Figure 1, we can see Apple Inc. (AAPL) forming a similar pattern along with the lower tops from June to August. This indicates weakness to sustain at the peak. Soon the stock had a nosedive to the lowest level at 90. The small gap down during the drop increased the selling pressure and boosted the bears. The bearish force on the stock can be identified by the size of the candles, before and after the gap down. The red candles, after the gap down day are comparatively larger. AAPL has lost more than 50% of the value price and is underperforming. The relative strength index (RSI) (14) plunged to the oversold area, but lacked the strength to rally above 30. As a result, its price also failed to recover from the support area at 90. |

|
| FIGURE 1: AAPL, DAILY. The bearish engulfing pattern, the overheated downtrend, and the RSI (14) tangled near the oversold zone together can pull down the AAPL to the lowest support at 90. |
| Graphic provided by: StockCharts.com. |
| |
| The second attempt to bounce was made on marginal volume, but the gap down level suppressed the rally and would act as strong resistance in the future as well. Under new resistance, AAPL formed a bearish engulfing pattern and diluted the bullish move. The second red candle (see the circle) is long with a small lower shadow. This suggests that the stock had lost the entire intraday gains and the previous low at 90 may be a retest. Another reason that would support my anticipation is the highly overheated downtrend. The average directional movement index (ADX) (14) is declining, but the selling pressure indicated by the negative directional index (-DI) is ready to surge. So although the trendline is descending, the downtrend would sustain. |
| In addition, the RSI (14) has marginally moved above the oversold zone. The indicator is engulfed by negative momentum, and therefore, AAPL may retrace to the prior low. The stock may consolidate in the range of 90–120, which may also form a strong bottom and prevent a further slide. |

|
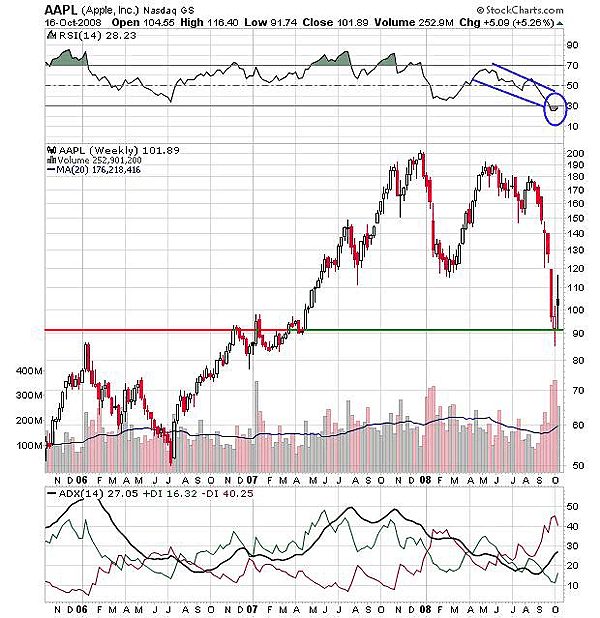
| FIGURE 2: AAPL, WEEKLY. AAPL is likely to establish the support at 90. |
| Graphic provided by: StockCharts.com. |
| |
| According to the weekly chart (Figure 2), 90 was the strong resistance level for AAPL in 2006–07. The support–resistance line tool is used to identify the important breakout points. The resistance was converted to the support in April 2007, and AAPL entered a strong uptrend. Recently, the stock has retraced to the same support at 90 after a long bull ride. It is highly essential to establish support to prevent AAPL from a long-term downtrend. But the support may not be breached as the momentum indicator is highly oversold, and minor pullback rallies are possible. However, these rallies can extend only up to the 120 resistance level. |
| Since both charts show resistance at the same level, AAPL may undergo a rangebound move in the near future. The stock has declined more than 50%, and a further slump may harm the long-term trend, so consolidation at current level is important. The consolidation under the oversold condition may form the bottom for the future bullish rally. But the traders can initiate a short trade from the 120 level with the target of 90 and vice versa for a long trade. A stop-loss of 10 points can be placed for the trade on either side. |
Active trader in the Indian stock markets since 2003 and a full-time writer. Trading is largely based upon technical analysis.
| Company: | Independent |
| Address: | C1/3 Parth Indraprasth Towers. Vastrapur |
| Ahmedabad, Guj 380015 | |
| E-mail address: | chaitalimohile@yahoo.co.in |
Traders' Resource Links | |
| Independent has not added any product or service information to TRADERS' RESOURCE. | |
Click here for more information about our publications!
PRINT THIS ARTICLE

Request Information From Our Sponsors
- StockCharts.com, Inc.
- Candle Patterns
- Candlestick Charting Explained
- Intermarket Technical Analysis
- John Murphy on Chart Analysis
- John Murphy's Chart Pattern Recognition
- John Murphy's Market Message
- MurphyExplainsMarketAnalysis-Intermarket Analysis
- MurphyExplainsMarketAnalysis-Visual Analysis
- StockCharts.com
- Technical Analysis of the Financial Markets
- The Visual Investor
- VectorVest, Inc.
- Executive Premier Workshop
- One-Day Options Course
- OptionsPro
- Retirement Income Workshop
- Sure-Fire Trading Systems (VectorVest, Inc.)
- Trading as a Business Workshop
- VectorVest 7 EOD
- VectorVest 7 RealTime/IntraDay
- VectorVest AutoTester
- VectorVest Educational Services
- VectorVest OnLine
- VectorVest Options Analyzer
- VectorVest ProGraphics v6.0
- VectorVest ProTrader 7
- VectorVest RealTime Derby Tool
- VectorVest Simulator
- VectorVest Variator
- VectorVest Watchdog
