HOT TOPICS LIST
- MACD
- Fibonacci
- RSI
- Gann
- ADXR
- Stochastics
- Volume
- Triangles
- Futures
- Cycles
- Volatility
- ZIGZAG
- MESA
- Retracement
- Aroon
INDICATORS LIST
LIST OF TOPICS
PRINT THIS ARTICLE
by James Kupfer
Does history say anything about the potential for a bottom, given that the Dow Jones 30 is down more than 20% this month?
Position: Accumulate
James Kupfer
Mr. Kupfer is a market professional and amateur stock market commentator. Disclosure: It is likely that Mr. Kupfer has or will enter a position in any security he writes about.
PRINT THIS ARTICLE
CYCLES
Getting Ready For A Bottom
10/20/08 08:57:43 AMby James Kupfer
Does history say anything about the potential for a bottom, given that the Dow Jones 30 is down more than 20% this month?
Position: Accumulate
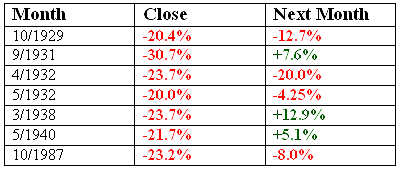
| Figure 1 is a chart of each time since 1915 that the Dow Jones 30 has closed more than 20% down for the month. Based on this data, it is unlikely that October 2008 will close lower than we are currently. Even if it does, history suggests that it will likely be a good time to buy for at least the intermediate term. |

|
| FIGURE 1: DJIA, SINCE 1915. This chart shows each time since 1915 that the Dow Jones 30 has closed more than 20% down for the month. |
| Graphic provided by: Excel graph. |
| |
| There have been 1,125 months since January 1915, and only seven of those months closed down more than 20%. That is a mere 0.6% of all the months. Could it happen again now? Sure, but it is not exceptionally likely. This is perhaps the strong piece of data suggesting the market is at or nearing a near-term bottom. |
| During the seven periods listed in the chart, three of the subsequent months had gains following the loss. While those odds are clearly not great and we are clearly working with a very limited dataset, there are a few additional items of interest. |
| December 1929 through February 1930 were all up months. July and August 1932 had gains of 26% and 35.8%, respectively, and these gains took the DJIA above the peak from April 1932. It took only three months to surpass the peak from March 1938 after the market bottom that same month. The five months after May 1940 were all up. |
| All in all, 1987 was the only period I found in which the subsequent month was not up or at least the next few months following the 20% drop were not consequentially up. This is still a trader's market and under no circumstances would I suggest blindly buying and holding for a bounce that may or may not occur, but with any hope, these limited analyses will remind the reader that logic should rule their decisions, not fear. |
Mr. Kupfer is a market professional and amateur stock market commentator. Disclosure: It is likely that Mr. Kupfer has or will enter a position in any security he writes about.
Click here for more information about our publications!
Comments

Request Information From Our Sponsors
- StockCharts.com, Inc.
- Candle Patterns
- Candlestick Charting Explained
- Intermarket Technical Analysis
- John Murphy on Chart Analysis
- John Murphy's Chart Pattern Recognition
- John Murphy's Market Message
- MurphyExplainsMarketAnalysis-Intermarket Analysis
- MurphyExplainsMarketAnalysis-Visual Analysis
- StockCharts.com
- Technical Analysis of the Financial Markets
- The Visual Investor
- VectorVest, Inc.
- Executive Premier Workshop
- One-Day Options Course
- OptionsPro
- Retirement Income Workshop
- Sure-Fire Trading Systems (VectorVest, Inc.)
- Trading as a Business Workshop
- VectorVest 7 EOD
- VectorVest 7 RealTime/IntraDay
- VectorVest AutoTester
- VectorVest Educational Services
- VectorVest OnLine
- VectorVest Options Analyzer
- VectorVest ProGraphics v6.0
- VectorVest ProTrader 7
- VectorVest RealTime Derby Tool
- VectorVest Simulator
- VectorVest Variator
- VectorVest Watchdog
