HOT TOPICS LIST
- MACD
- Fibonacci
- RSI
- Gann
- ADXR
- Stochastics
- Volume
- Triangles
- Futures
- Cycles
- Volatility
- ZIGZAG
- MESA
- Retracement
- Aroon
INDICATORS LIST
LIST OF TOPICS
PRINT THIS ARTICLE
by Chaitali Mohile
During consolidation, the US Dollar Index is likely to enter wild volatile sessions and may retrace to a previous low pivot.
Position: N/A
Chaitali Mohile
Active trader in the Indian stock markets since 2003 and a full-time writer. Trading is largely based upon technical analysis.
PRINT THIS ARTICLE
CONSOLID FORMATION
The Volatile US Dollar
10/17/08 08:56:19 AMby Chaitali Mohile
During consolidation, the US Dollar Index is likely to enter wild volatile sessions and may retrace to a previous low pivot.
Position: N/A
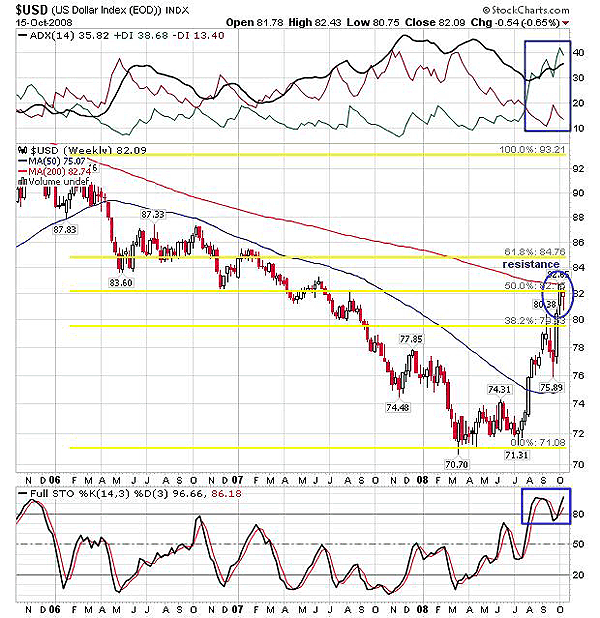
| After a huge descending run, the US Dollar Index ($USD) formed a bottom by consolidating in the lower range of 70–74. The consolidation range broke off in July, and $USD entered a fresh uptrend after a long period of two years. Thereafter, the dollar index appreciated, and the trend was well developed. According to Figure 1, the index has recovered to about 50% Fibonacci retracement levels, and the stochastic (14,3,3) also saw a highly overbought area. The 50% Fibonacci retacement level and a declining 200-day moving average (MA) may slow down the dollar growth. |

|
| FIGURE 1: $USD, WEEKLY. $USD is under the resistance of the 50% Fibonacci retracement level, and a 200-day moving average. |
| Graphic provided by: StockCharts.com. |
| |
| $USD may undergo a volatile consolidation phase in the narrow range of 80–82, as the stochastic (14,3,3) is highly overbought and the trend remains bullish. The stochastic may show shaky moves in this zone that can result in price volatility. The oscillator can remain overbought for some more time, but the price level is likely to fluctuate. In the current financial situation, it looks like $USD may surge above the resistance and appreciate another $2. But before the breakout happens, the index is likely to remain highly sensitive, and in the worst-case scenario, the lower support of $80 may be challenged |

|
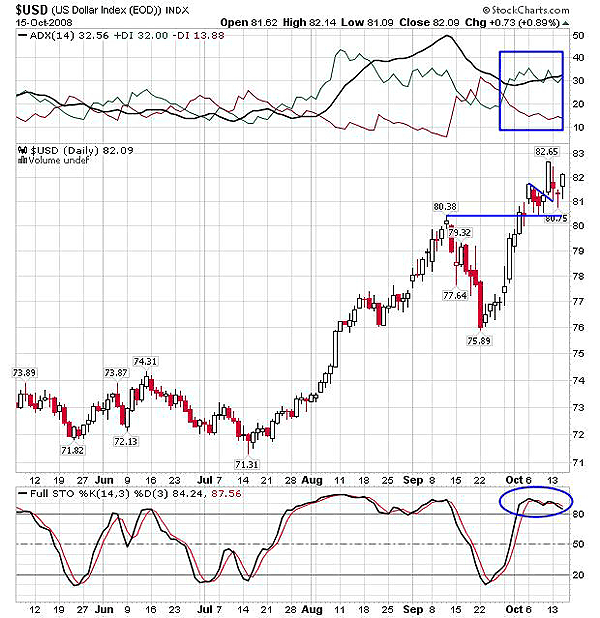
| FIGURE 2: $USD, DAILY. The entire bullish rally from July shows $USD is consolidating with the support of $80. |
| Graphic provided by: StockCharts.com. |
| |
| Figure 2 shows the upward journey of the dollar index since July 2008. $USD had a steep advance rally from the breakout level at 74, reached the high of 80, and retraced to the previous support of 76. $USD established support at 76, and the rally with the target of a previous high of 80 was born. The ascending move was followed by consolidation in the range of 80–82. The breakout failed due to the resistance levels that we saw on the weekly time frame. The stochastic (14,3,3) in Figure 2 is overbought, and the decline below 80 levels would be alarming. The average directional movement index (ADX) (14) indicates a developed uptrend. Therefore, $USD may consolidate in the range of 80–82. But since financial markets currently are full of uncertainty, high volatility cannot be ruled out. |
Active trader in the Indian stock markets since 2003 and a full-time writer. Trading is largely based upon technical analysis.
| Company: | Independent |
| Address: | C1/3 Parth Indraprasth Towers. Vastrapur |
| Ahmedabad, Guj 380015 | |
| E-mail address: | chaitalimohile@yahoo.co.in |
Traders' Resource Links | |
| Independent has not added any product or service information to TRADERS' RESOURCE. | |
Click here for more information about our publications!
PRINT THIS ARTICLE

Request Information From Our Sponsors
- StockCharts.com, Inc.
- Candle Patterns
- Candlestick Charting Explained
- Intermarket Technical Analysis
- John Murphy on Chart Analysis
- John Murphy's Chart Pattern Recognition
- John Murphy's Market Message
- MurphyExplainsMarketAnalysis-Intermarket Analysis
- MurphyExplainsMarketAnalysis-Visual Analysis
- StockCharts.com
- Technical Analysis of the Financial Markets
- The Visual Investor
- VectorVest, Inc.
- Executive Premier Workshop
- One-Day Options Course
- OptionsPro
- Retirement Income Workshop
- Sure-Fire Trading Systems (VectorVest, Inc.)
- Trading as a Business Workshop
- VectorVest 7 EOD
- VectorVest 7 RealTime/IntraDay
- VectorVest AutoTester
- VectorVest Educational Services
- VectorVest OnLine
- VectorVest Options Analyzer
- VectorVest ProGraphics v6.0
- VectorVest ProTrader 7
- VectorVest RealTime Derby Tool
- VectorVest Simulator
- VectorVest Variator
- VectorVest Watchdog
