HOT TOPICS LIST
- MACD
- Fibonacci
- RSI
- Gann
- ADXR
- Stochastics
- Volume
- Triangles
- Futures
- Cycles
- Volatility
- ZIGZAG
- MESA
- Retracement
- Aroon
INDICATORS LIST
LIST OF TOPICS
PRINT THIS ARTICLE
by James Kupfer
The CRB has fallen to a significant Fibonacci retracement level. Look for a bounce near here.
Position: Buy
James Kupfer
Mr. Kupfer is a market professional and amateur stock market commentator. Disclosure: It is likely that Mr. Kupfer has or will enter a position in any security he writes about.
PRINT THIS ARTICLE
FIBONACCI
Another CRB Support Level
10/16/08 08:21:38 AMby James Kupfer
The CRB has fallen to a significant Fibonacci retracement level. Look for a bounce near here.
Position: Buy
| Last Monday (October 6, 2008), I reported that the CRB index was approaching a convergence of support zones around 328 that "may help the CRB from falling any further." They did not. |
| The CRB briefly paused at the support level I pointed out and then proceeded to plummet through it. A little over a week later, the CRB is now at another important support level near 293. |
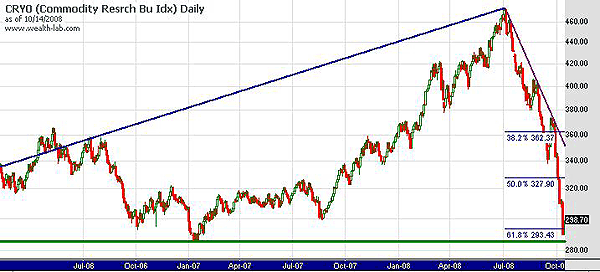
| There are two important points of support that the CRB is currently at. First is a 61.8% Fibonacci retracement level drawn between the start of the commodity bull market in November 2001 to its recent top in June/July (Figure 1). This is a very long-term support line that should be of major importance. Second, the CRB is approaching the green support line drawn from the major January 2007 bottom. |

|
| FIGURE 1: CRB, DAILY. This long-term support line should be of importance. |
| Graphic provided by: Wealth-lab. |
| |
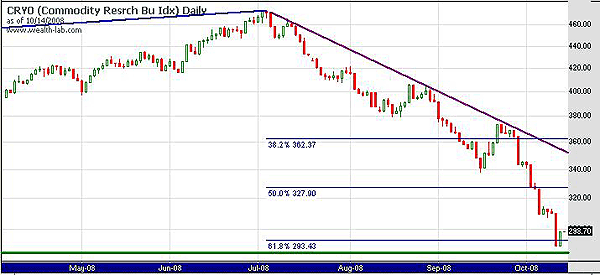
| While this 293 level is not likely to hold for the long term, it could prove to be a major bottom for the next few weeks to months (Figure 2). Should it not hold, then look out for the next major support level around 250. |

|
| FIGURE 2: CRB, DAILY. While this 293 level is not likely to hold for the long term, it could prove to be a major bottom for the next few weeks to months. |
| Graphic provided by: Wealth-lab. |
| |
Mr. Kupfer is a market professional and amateur stock market commentator. Disclosure: It is likely that Mr. Kupfer has or will enter a position in any security he writes about.
Click here for more information about our publications!
PRINT THIS ARTICLE

Request Information From Our Sponsors
- StockCharts.com, Inc.
- Candle Patterns
- Candlestick Charting Explained
- Intermarket Technical Analysis
- John Murphy on Chart Analysis
- John Murphy's Chart Pattern Recognition
- John Murphy's Market Message
- MurphyExplainsMarketAnalysis-Intermarket Analysis
- MurphyExplainsMarketAnalysis-Visual Analysis
- StockCharts.com
- Technical Analysis of the Financial Markets
- The Visual Investor
- VectorVest, Inc.
- Executive Premier Workshop
- One-Day Options Course
- OptionsPro
- Retirement Income Workshop
- Sure-Fire Trading Systems (VectorVest, Inc.)
- Trading as a Business Workshop
- VectorVest 7 EOD
- VectorVest 7 RealTime/IntraDay
- VectorVest AutoTester
- VectorVest Educational Services
- VectorVest OnLine
- VectorVest Options Analyzer
- VectorVest ProGraphics v6.0
- VectorVest ProTrader 7
- VectorVest RealTime Derby Tool
- VectorVest Simulator
- VectorVest Variator
- VectorVest Watchdog
