HOT TOPICS LIST
- MACD
- Fibonacci
- RSI
- Gann
- ADXR
- Stochastics
- Volume
- Triangles
- Futures
- Cycles
- Volatility
- ZIGZAG
- MESA
- Retracement
- Aroon
INDICATORS LIST
LIST OF TOPICS
PRINT THIS ARTICLE
by James Kupfer
A bottom of meaningful significance seems to have been made in the major equity indexes. Where are the significant resistance points going forward?
Position: Hold
James Kupfer
Mr. Kupfer is a market professional and amateur stock market commentator. Disclosure: It is likely that Mr. Kupfer has or will enter a position in any security he writes about.
PRINT THIS ARTICLE
FIBONACCI
Ready To Resume Shorting?
10/15/08 09:16:31 AMby James Kupfer
A bottom of meaningful significance seems to have been made in the major equity indexes. Where are the significant resistance points going forward?
Position: Hold
| A lot has happened in the last week in the global equity markets. On October 7, I wrote regarding the S&P 500 that "we are approaching a point where nimble traders can close out short positions and look to establish short-term long positions...I suspect that any bounce we get will be short-lived." Further, I wrote that "I would treat this as a good trading opportunity and a chance to reestablish short positions for the resumption of a move down." |
| While the markets did present traders a few opportunities over the following days for quick gains to the upside, the market was even weaker than I had anticipated. The S&P 500 dropped from 1041 to a low of 839. As of midday October 14, we are back to 1000. What a wild ride! |
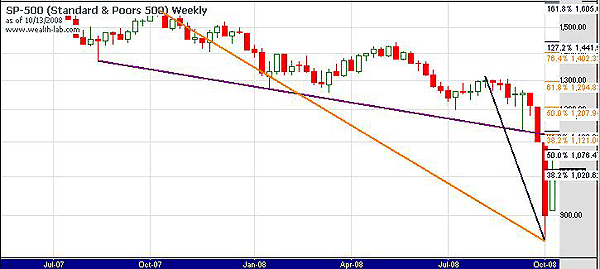
| Given that a low of at least minor significance seems to have been made, it seems a good time to figure out where significant resistance points might be on any price rebound. Figure 1 is a weekly chart of the S&P 500 updated as of midday October 14. On it are two major Fibonacci retracement levels in gold and dark blue along with a trendline in purple. |

|
| FIGURE 1: S&P 500, WEEKLY. Note the two major Fibonacci retracement levels in gold and dark blue along with a trendline in purple. |
| Graphic provided by: Wealth-lab. |
| |
| The S&P has already surpassed the 28% retracement level drawn between August 2008 and the recent low. The 50% retracement level for this same period lies at 1076. Not shown on the chart is the 61.8% retracement level at 1077 found by using the period between October 2002 and October 2007. Between 1121–1122 are the 38.2% and 61.8% retracement levels for August to October and the October 2007 to October 2008 moves, respectively. This also happens to be within points of the purple trendline as well, which will now provide resistance to prices instead of support. I will not detail the other retracement levels higher up, although they are marked on the chart. |
| In short, 1077 and 1122 are both going to be significant resistance levels for the S&P 500. Should the market reach these at least to the 1077 level, which I think is likely, it may well make a good point at which to consider initiating new short positions. It would take a move above 1300 to start thinking about the back of the bear as being broken. Until then, the trend is down. As always, trade with stops. |
Mr. Kupfer is a market professional and amateur stock market commentator. Disclosure: It is likely that Mr. Kupfer has or will enter a position in any security he writes about.
Click here for more information about our publications!
Comments
Date: 10/16/08Rank: 5Comment:

Request Information From Our Sponsors
- StockCharts.com, Inc.
- Candle Patterns
- Candlestick Charting Explained
- Intermarket Technical Analysis
- John Murphy on Chart Analysis
- John Murphy's Chart Pattern Recognition
- John Murphy's Market Message
- MurphyExplainsMarketAnalysis-Intermarket Analysis
- MurphyExplainsMarketAnalysis-Visual Analysis
- StockCharts.com
- Technical Analysis of the Financial Markets
- The Visual Investor
- VectorVest, Inc.
- Executive Premier Workshop
- One-Day Options Course
- OptionsPro
- Retirement Income Workshop
- Sure-Fire Trading Systems (VectorVest, Inc.)
- Trading as a Business Workshop
- VectorVest 7 EOD
- VectorVest 7 RealTime/IntraDay
- VectorVest AutoTester
- VectorVest Educational Services
- VectorVest OnLine
- VectorVest Options Analyzer
- VectorVest ProGraphics v6.0
- VectorVest ProTrader 7
- VectorVest RealTime Derby Tool
- VectorVest Simulator
- VectorVest Variator
- VectorVest Watchdog
