

HOT TOPICS LIST
- MACD
- Fibonacci
- RSI
- Gann
- ADXR
- Stochastics
- Volume
- Triangles
- Futures
- Cycles
- Volatility
- ZIGZAG
- MESA
- Retracement
- Aroon
INDICATORS LIST
LIST OF TOPICS
PRINT THIS ARTICLE
by Chaitali Mohile
The First Industrial Realty is undergoing a pullback rally on weaker notes. Can the lost support be regained?
Position: N/A
Chaitali Mohile
Active trader in the Indian stock markets since 2003 and a full-time writer. Trading is largely based upon technical analysis.
PRINT THIS ARTICLE
SUPPORT & RESISTANCE
FR Regaining Support
10/15/08 01:36:50 PMby Chaitali Mohile
The First Industrial Realty is undergoing a pullback rally on weaker notes. Can the lost support be regained?
Position: N/A
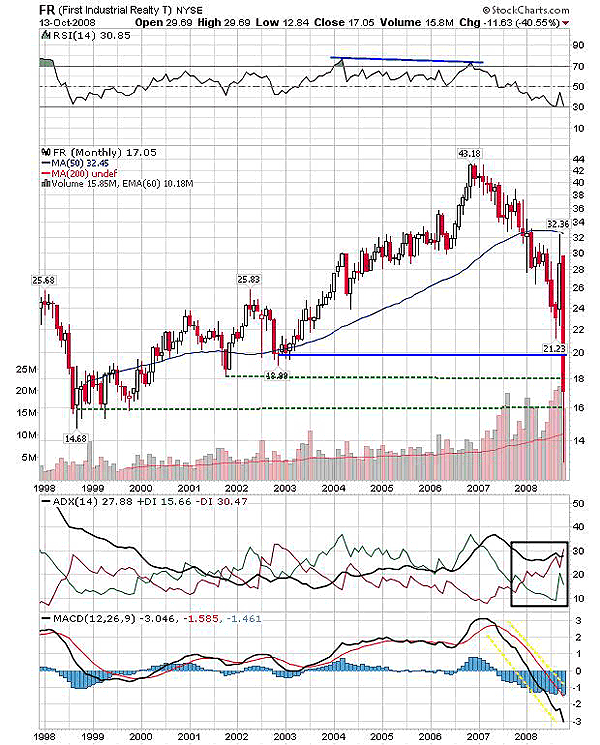
| The First Industrial Realty (FR) made an all-time high in 2007 at 43.18 levels. The stock declined from the top with no serious bearish signs. The double top formed by the relative strength index (RSI) (14) in Figure 1 might be the reason why. The average directional movement index (ADX) (14) showed a developing uptrend with appropriate buying and selling pressure that leads to a bullish rally. Technically, an advance rally is followed by a correction or a consolidation phase. So the situation was pretty normal till the support of the 50-day moving average (MA) was held. The correction turned into a serious bearish trend as FR violated 50-day MA support. |
|
| FIGURE 1: FR, MONTHLY. FR is undergoing a pullback rally. The rally may regain the previous lost support of the stock. |
| Graphic provided by: StockCharts.com. |
| |
| The entire bullish picture changed with this newly formed resistance. The RSI (14) moved below the bullish support of 50, the ADX (14) shows trend reversal, and the moving average convergence/divergence (MACD) (12,26,9) plunged to negative territory. These bearish conditions gradually dragged FR below the sensitive support zones (see Figure 1). Earlier, the new upward rallies were born with the support of 16, 18, and 20 levels, and hence, during the current descent, these levels were the last hope for the bulls. But the recent relief package has relieved FR from an even deeper fall below 12 (the new low made in the last decade). The stock is trying to regain its lost support and resume the bullish path. Although FR has moved to 17 from 12, the indicators have failed to follow the price movement. So this divergence may restrict future price action. |
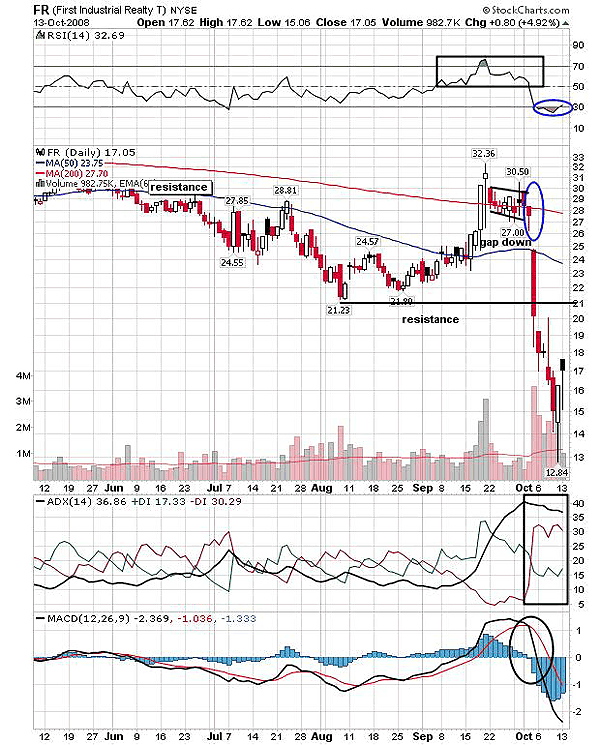
| The daily chart (Figure 2) would explain the reason and stability of the current pullback rally. The advance rally from 21 paused under the support-resistance of a 200-day moving average (MA). FR consolidated in this area, and the overbought RSI (14) rushed to establish the support at 50 but later failed. The hanging man (see the blue circle) in Figure 2 was the bearish reversal indicator that increased the selling pressure, resulting in a gap down. The stock turned highly bearish and soon reached its lifetime low of 12. Due to the prolonged fall, the RSI (14) is highly oversold, and the downtrend is overheated. The technical situation and the liquidity supply by the US government gave birth to the current situation. |
|
| FIGURE 2: FR, DAILY. Due to the oversold RSI (14) and the declining ADX (14) from overheated levels, the stock is undergoing a relief rally. |
| Graphic provided by: StockCharts.com. |
| |
| The rally would pull the momentum indicators above the bearish levels and may create room for further downside. The pullback rally has the resistance of the previous low of 21 and the declining 50-day MA. Traders can enter fresh short positions with the target of 12 under this resistance as the main trend remains down. Hence, FR may regain the previous support levels on present bullish sentiments, but sustaining at those levels looks difficult. |
Active trader in the Indian stock markets since 2003 and a full-time writer. Trading is largely based upon technical analysis.
| Company: | Independent |
| Address: | C1/3 Parth Indraprasth Towers. Vastrapur |
| Ahmedabad, Guj 380015 | |
| E-mail address: | chaitalimohile@yahoo.co.in |
Traders' Resource Links | |
| Independent has not added any product or service information to TRADERS' RESOURCE. | |
Click here for more information about our publications!
PRINT THIS ARTICLE

Request Information From Our Sponsors
- StockCharts.com, Inc.
- Candle Patterns
- Candlestick Charting Explained
- Intermarket Technical Analysis
- John Murphy on Chart Analysis
- John Murphy's Chart Pattern Recognition
- John Murphy's Market Message
- MurphyExplainsMarketAnalysis-Intermarket Analysis
- MurphyExplainsMarketAnalysis-Visual Analysis
- StockCharts.com
- Technical Analysis of the Financial Markets
- The Visual Investor
- VectorVest, Inc.
- Executive Premier Workshop
- One-Day Options Course
- OptionsPro
- Retirement Income Workshop
- Sure-Fire Trading Systems (VectorVest, Inc.)
- Trading as a Business Workshop
- VectorVest 7 EOD
- VectorVest 7 RealTime/IntraDay
- VectorVest AutoTester
- VectorVest Educational Services
- VectorVest OnLine
- VectorVest Options Analyzer
- VectorVest ProGraphics v6.0
- VectorVest ProTrader 7
- VectorVest RealTime Derby Tool
- VectorVest Simulator
- VectorVest Variator
- VectorVest Watchdog