HOT TOPICS LIST
- MACD
- Fibonacci
- RSI
- Gann
- ADXR
- Stochastics
- Volume
- Triangles
- Futures
- Cycles
- Volatility
- ZIGZAG
- MESA
- Retracement
- Aroon
INDICATORS LIST
LIST OF TOPICS
PRINT THIS ARTICLE
by Ron Walker
The Dow Jones Industrial Average put in its worst week in history. Is the tsunami of selling over?
Position: N/A
Ron Walker
Ron Walker is an active trader and technical analyst. He operates an educational website dedicated to the study of Technical Analysis. The website offers free market analysis with daily video presentations and written commentaries. Ron is a video pioneer, being one of the first to utilize the internet producing Technical Analysis videos. His website is thechartpatterntrader.com
PRINT THIS ARTICLE
The Selloff Tsunami
10/14/08 11:52:57 AMby Ron Walker
The Dow Jones Industrial Average put in its worst week in history. Is the tsunami of selling over?
Position: N/A
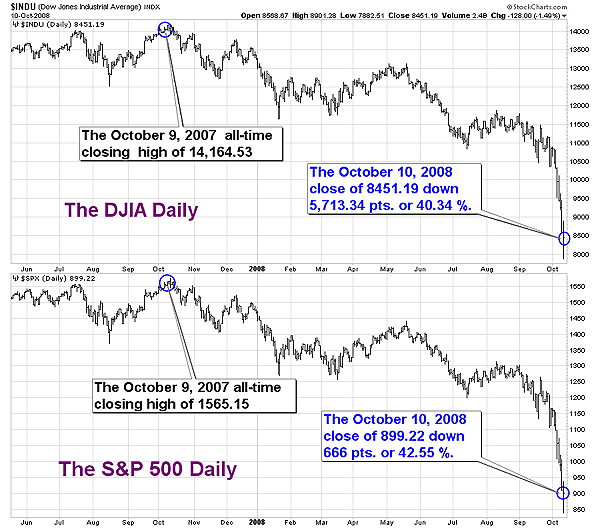
| Just one year and one day after its all-time closing high of 15,164.53, made on October 9, 2007, the Dow Jones Industrial Average (DJIA) dropped an eye-popping 5,713.34 points and has lost 40.34%. The Standard & Poor's 500 (S&P 500) has had an unholy fall of 666 points or approximately 42.55 % from its all-time closing high of 1,565.15, which was also made on October 9, 2007. These figures and percentage calculations are from closing high to closing low. Their fall from grace can be seen over the past year in Figure 1. After the DJIA put in the worst week in its 112-year history, the S&P 500's 666-point drop seems like a fitting number to be associated with this diabolical disaster. |

|
| FIGURE 1: DJIA, DAILY. The DJIA and the S&P 500 are both down over 40% since their closing all-time highs made on October 9, 2007. |
| Graphic provided by: StockCharts.com. |
| |
| The market is purging itself of the poison that the government has inflicted on it by subsidizing the housing market via Fannie Mae and Freddie Mac. Now they sit on the balance sheets of banks, which led up to a locking-up of the credit markets in the last few weeks. With the passage of the $700 billion bailout package, there is still great uncertainty as to how it will be implemented, adding further anxiety to investors. Thus, this shock & awe-type campaign against the stock market has literally bombarded and assaulted global markets everywhere. The market meltdown could be stabilized once the Bush administration lays out a plan of action. Such actions could include the injecting of capital into the banking system and/or buying straight and perferred shares in the financial sector, which would put money on the banks' balance sheets, giving Uncle Sam a stake in the banks. |
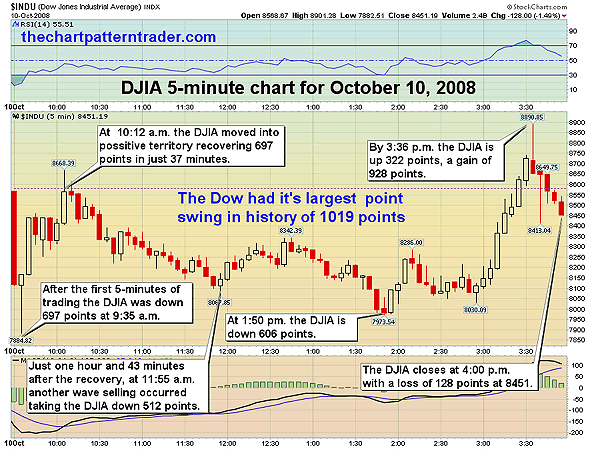
| Mr. Toad's Wild Ride isn't just a ride at Disneyland! It is exactly what happened last Friday, on October 10, 2008. There were more back-and-forth swings that day on the DJIA than any other time in its 112-year history. In Figure 2, these swings started the day with the DJIA opening in a freefall, dropping 697 points just five minutes after the opening bell. Then by 10:12 a.m, prices erased all losses and inched up into positive territory momentarily. Then for the next few hours, prices staggered, falling first 512 points and then rallying back up 275 points in less than an hour. Prices lowered after that rally attempt faltered and the DJIA racked up steep losses again, spiraling down 606 points by 1:50 p.m. By 3:36 p.m., prices made a breathtaking climb higher and managed to rally up 928 points as traders picked up stocks before the weekend, putting the DJIA in the positive column by 322 points. But as the last 10 minutes of trading occurred, the DJIA pulled back into negative territory, closing the day down 128 points or 1.49%. It's not surprising that the DJIA ended the session posting the largest price swing in history of 1,019 points (Figure 2), given this amusement park atmosphere. |

|
| FIGURE 2: DJIA, FIVE-MINUTE. On October 10, 2008, the DJIA had the largest point swing in its 112-year history. The wild swings ended the session with a range of 1,019 points. The rallies made after 9:35 a.m. and during the last hour were most impressive. These sudden changes of mood and behavior in prices reveal that the bulls and the bears were fighting it out for control of the market. |
| Graphic provided by: StockCharts.com. |
| |
| It was a week of record events for the DJIA as it also posted its worst week in history. This was the worst week in the 112-year history for the DJIA and the stock market as a whole, with the S&P 500 losing a record 200 points or 18.20%. And the DJIA lost a staggering 1,874 points or 18.15% for the week. Over the last two weeks, the DJIA has shed 2,688 points. And in the last eight days of its consecutive losing streak, the DJIA has gotten just over a 2,400-point haircut. Whether a bottom has been put in is a matter of opinion, but given that the stock market is made up largely of fear and greed, we may have put in a tradable bottom. The stock market has worked like game shows, Greed and Fear Factor. As the bottom fell out of the stock market last week as fear ran rampant, it may begin to rise on balance as greed set in as investors gobbled up stocks that were just massacred in this tsunami selloff. Extreme caution should be used if any bottom appears with reference to long-term position trading, because greed may take prices up for the short term in a rubber band rally, but it may be built on quicksand. This is clearly a day/swing trading environment. |

|
| FIGURE 3: DJIA, ONE-MINUTE. Here on the minute-by-minute chart, the point and percentage losses of each trading session are marked during its worst week in history, October 6 to 10, 2008. |
| Graphic provided by: StockCharts.com. |
| |
Ron Walker is an active trader and technical analyst. He operates an educational website dedicated to the study of Technical Analysis. The website offers free market analysis with daily video presentations and written commentaries. Ron is a video pioneer, being one of the first to utilize the internet producing Technical Analysis videos. His website is thechartpatterntrader.com
| Website: | thechartpatterntrader.com |
| E-mail address: | thechartpatterntrader@gmail.com |
Click here for more information about our publications!
Comments
Date: 10/14/08Rank: 4Comment:

Request Information From Our Sponsors
- StockCharts.com, Inc.
- Candle Patterns
- Candlestick Charting Explained
- Intermarket Technical Analysis
- John Murphy on Chart Analysis
- John Murphy's Chart Pattern Recognition
- John Murphy's Market Message
- MurphyExplainsMarketAnalysis-Intermarket Analysis
- MurphyExplainsMarketAnalysis-Visual Analysis
- StockCharts.com
- Technical Analysis of the Financial Markets
- The Visual Investor
- VectorVest, Inc.
- Executive Premier Workshop
- One-Day Options Course
- OptionsPro
- Retirement Income Workshop
- Sure-Fire Trading Systems (VectorVest, Inc.)
- Trading as a Business Workshop
- VectorVest 7 EOD
- VectorVest 7 RealTime/IntraDay
- VectorVest AutoTester
- VectorVest Educational Services
- VectorVest OnLine
- VectorVest Options Analyzer
- VectorVest ProGraphics v6.0
- VectorVest ProTrader 7
- VectorVest RealTime Derby Tool
- VectorVest Simulator
- VectorVest Variator
- VectorVest Watchdog
