HOT TOPICS LIST
- MACD
- Fibonacci
- RSI
- Gann
- ADXR
- Stochastics
- Volume
- Triangles
- Futures
- Cycles
- Volatility
- ZIGZAG
- MESA
- Retracement
- Aroon
INDICATORS LIST
LIST OF TOPICS
PRINT THIS ARTICLE
by Alan R. Northam
XLU formed a head & shoulders major trend reversal pattern and has hit the price target based upon this pattern. Is XLU now ready to bounce or will it continue lower?
Position: N/A
Alan R. Northam
Alan Northam lives in the Dallas, Texas area and as an electronic engineer gave him an analytical mind from which he has developed a thorough knowledge of stock market technical analysis. His abilities to analyze the future direction of the stock market has allowed him to successfully trade of his own portfolio over the last 30 years. Mr. Northam is now retired and trading the stock market full time. You can reach him at inquiry@tradersclassroom.com or by visiting his website at http://www.tradersclassroom.com. You can also follow him on Twitter @TradersClassrm.
PRINT THIS ARTICLE
HEAD & SHOULDERS
Utilities Select SPDR Hits Target
10/13/08 09:44:30 AMby Alan R. Northam
XLU formed a head & shoulders major trend reversal pattern and has hit the price target based upon this pattern. Is XLU now ready to bounce or will it continue lower?
Position: N/A
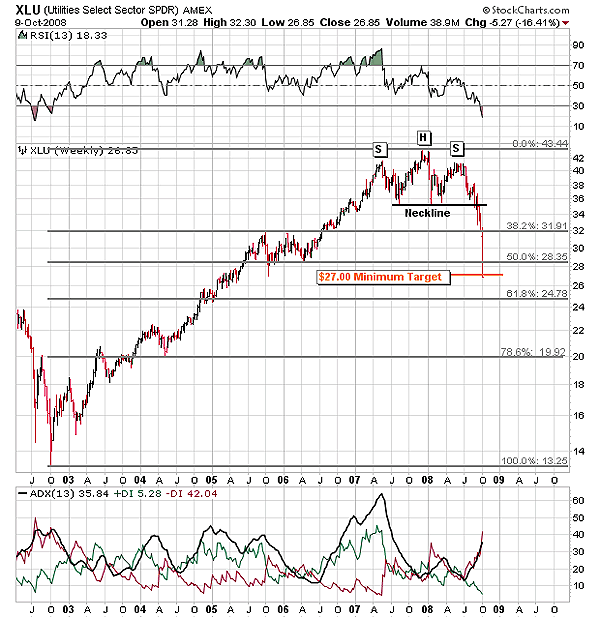
| On August 8, I wrote an article entitled "Utilities Select SPDR Head & Shoulders." In that article, I showed the expected price target of $27.00 per share for XLU. I encourage all to read that article for background information and how this price target was arrived. Figure 1 shows a similar weekly chart as was published on August 8. This chart shows the large head & shoulders major trend reversal pattern that took more than one year to complete. Head & shoulders patterns are complete when the neckline is clearly broken. Figure 1 also shows that the price target for XLU has now been reached. Price targets are just that: they are targets and do not necessarily indicate that the particular market will reverse its trend. |
| Figure 1 includes the relative strength index (RSI). This index shows that it has now fallen below its 30% level, indicating that XLU has been oversold. Normally, when a stock or market has become oversold, it sets itself up for a bounce to relieve this oversold condition. When the market bounces or turns upward, the RSI will move back above its 30% line to indicate that the market is relieving itself of its oversold condition. However, in a strongly trending market, the RSI can remain in oversold territory for quite some time. For this reason, I have also shown the average directional movement index (ADX). ADX (black line) has recently moved above its 30% line, indicating that a strong trend is in place for XLU. Therefore, it is possible for the RSI to stay below its 30% line and may not move above it for quite some time before signaling a bounce is in place. |

|
| FIGURE 1: XLU, WEEKLY. This chart shows the head & shoulder major trend reversal pattern. This chart also shows the minimum price target derived from this reversal pattern. This chart also shows the Fibonacci retracement levels as high-probability areas for a market bounce. |
| Graphic provided by: StockCharts.com. |
| |
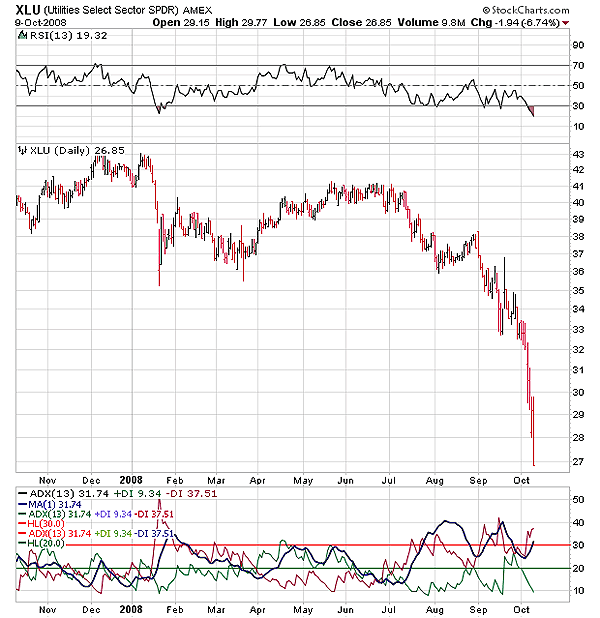
| In Figure 2, I zoom in on XLU by showing that daily price chart. The daily price chart shows that the RSI is below its 30% level signaling that XLU is also oversold on a daily basis. The ADX also shows the XLU is in a strong downtrend on a daily basis as well. Looking at the last daily bar on the chart, note that XLU opened near the top of its range and closed near the low of its range. This indicates that sellers are firmly in control of this market. Also this last bar made a lower high and a lower low compared to the previous bar, confirming that the downward trend is still in force. Note also that the daily bars have been getting longer over the last several days, indicating that the downward trend is gaining momentum. Therefore, by looking at the daily bars there is no indication that the downward trend is about to end. |

|
| FIGURE 2: XLU, DAILY. This chart shows the ADX and RSI. The ADX shows that XLU is in a strong downward trend and the RSI is showing that XLU has become oversold as a result of this strong downward trend. |
| Graphic provided by: StockCharts.com. |
| |
| To get an idea of the possible lower price level that could stop XLU from trending lower, I refer back to the Fibonacci retracement levels in Figure 1. Figure 1 shows that XLU has traded below the 50% retracement level. This indicates that XLU will most likely continue lower to the 61.8% retracement level, the next likely price level for a bounce to occur. However, should XLU trade through 61.8%, then the final stopping place is the 78.6% Fibonacci retracement price level. If XLU continues lower from there, then there exists a high probability that XLU will continue to move lower. XLU should then find strong support at the 2002 low. |
| In conclusion, XLU has now traded down to our minimum price target of $27 per share. However, there is no indication that XLU is about to turn back up. Therefore, expect XLU to continue lower and look for the ADX to turn lower and the RSI to turn upward to signal a bounce to relieve itself of its oversold condition. |
Alan Northam lives in the Dallas, Texas area and as an electronic engineer gave him an analytical mind from which he has developed a thorough knowledge of stock market technical analysis. His abilities to analyze the future direction of the stock market has allowed him to successfully trade of his own portfolio over the last 30 years. Mr. Northam is now retired and trading the stock market full time. You can reach him at inquiry@tradersclassroom.com or by visiting his website at http://www.tradersclassroom.com. You can also follow him on Twitter @TradersClassrm.
| Garland, Tx | |
| Website: | www.tradersclassroom.com |
| E-mail address: | inquiry@tradersclassroom.com |
Click here for more information about our publications!
Comments
Date: 10/14/08Rank: 5Comment:

Request Information From Our Sponsors
- StockCharts.com, Inc.
- Candle Patterns
- Candlestick Charting Explained
- Intermarket Technical Analysis
- John Murphy on Chart Analysis
- John Murphy's Chart Pattern Recognition
- John Murphy's Market Message
- MurphyExplainsMarketAnalysis-Intermarket Analysis
- MurphyExplainsMarketAnalysis-Visual Analysis
- StockCharts.com
- Technical Analysis of the Financial Markets
- The Visual Investor
- VectorVest, Inc.
- Executive Premier Workshop
- One-Day Options Course
- OptionsPro
- Retirement Income Workshop
- Sure-Fire Trading Systems (VectorVest, Inc.)
- Trading as a Business Workshop
- VectorVest 7 EOD
- VectorVest 7 RealTime/IntraDay
- VectorVest AutoTester
- VectorVest Educational Services
- VectorVest OnLine
- VectorVest Options Analyzer
- VectorVest ProGraphics v6.0
- VectorVest ProTrader 7
- VectorVest RealTime Derby Tool
- VectorVest Simulator
- VectorVest Variator
- VectorVest Watchdog
