HOT TOPICS LIST
- MACD
- Fibonacci
- RSI
- Gann
- ADXR
- Stochastics
- Volume
- Triangles
- Futures
- Cycles
- Volatility
- ZIGZAG
- MESA
- Retracement
- Aroon
INDICATORS LIST
LIST OF TOPICS
PRINT THIS ARTICLE
by James Kupfer
Cisco Systems is approaching a potential support line. But how solid is the support?
Position: Buy
James Kupfer
Mr. Kupfer is a market professional and amateur stock market commentator. Disclosure: It is likely that Mr. Kupfer has or will enter a position in any security he writes about.
PRINT THIS ARTICLE
SUPPORT & RESISTANCE
Cisco Nearing Support
10/13/08 09:29:28 AMby James Kupfer
Cisco Systems is approaching a potential support line. But how solid is the support?
Position: Buy
| Technical traders draw support and resistance lines by connecting lows, highs, or closing prices together. Low points should be connected to other lows, highs to highs, and so on. In addition, the time between connection points should generally not be so long as to call into question the validity of the support or resistance line. There is one other important thing to note: a line is formed by connecting two points, but until a security tests the line at a future date and that support or resistance line holds, it is nothing but an unconfirmed estimate of where support or resistance might be. A line is not valid until at least three points are connected, and the more successful test of a support/resistance line, the more solid the support. |
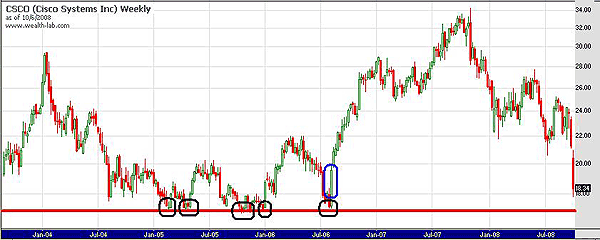
| Cisco Systems (CSCO) is approaching an old support zone that was formed between February 2005 and August 2006. In five separate instances, CSCO dropped to between $17.13 and $16.83. Having tested the $17 range of support five times qualifies this as a reasonably strong support zone on which to base a trade (Figure 1). |

|
| FIGURE 1: CSCO, WEEKLY. Having tested the $17 range of support five times qualifies this line as a reasonably strong support zone on which to base a trade. |
| Graphic provided by: Wealth-lab. |
| |
| In addition, note that the bar circled in blue on this weekly chart is actually a large gap between $17.65 and $19.35. Should Cisco continue to fill this gap and eventually close it, that would provide a good opportunity to consider going long while having a solid support level close by. |
Mr. Kupfer is a market professional and amateur stock market commentator. Disclosure: It is likely that Mr. Kupfer has or will enter a position in any security he writes about.
Click here for more information about our publications!
Comments
Date: 10/14/08Rank: 5Comment:

Request Information From Our Sponsors
- StockCharts.com, Inc.
- Candle Patterns
- Candlestick Charting Explained
- Intermarket Technical Analysis
- John Murphy on Chart Analysis
- John Murphy's Chart Pattern Recognition
- John Murphy's Market Message
- MurphyExplainsMarketAnalysis-Intermarket Analysis
- MurphyExplainsMarketAnalysis-Visual Analysis
- StockCharts.com
- Technical Analysis of the Financial Markets
- The Visual Investor
- VectorVest, Inc.
- Executive Premier Workshop
- One-Day Options Course
- OptionsPro
- Retirement Income Workshop
- Sure-Fire Trading Systems (VectorVest, Inc.)
- Trading as a Business Workshop
- VectorVest 7 EOD
- VectorVest 7 RealTime/IntraDay
- VectorVest AutoTester
- VectorVest Educational Services
- VectorVest OnLine
- VectorVest Options Analyzer
- VectorVest ProGraphics v6.0
- VectorVest ProTrader 7
- VectorVest RealTime Derby Tool
- VectorVest Simulator
- VectorVest Variator
- VectorVest Watchdog
