HOT TOPICS LIST
- MACD
- Fibonacci
- RSI
- Gann
- ADXR
- Stochastics
- Volume
- Triangles
- Futures
- Cycles
- Volatility
- ZIGZAG
- MESA
- Retracement
- Aroon
INDICATORS LIST
LIST OF TOPICS
PRINT THIS ARTICLE
by James Kupfer
Big Lots has broken down technically over the last few months and appears to be heading down. How much further will it go?
Position: Sell
James Kupfer
Mr. Kupfer is a market professional and amateur stock market commentator. Disclosure: It is likely that Mr. Kupfer has or will enter a position in any security he writes about.
PRINT THIS ARTICLE
GAPS
A BIG (Lots) Followup
10/13/08 09:23:53 AMby James Kupfer
Big Lots has broken down technically over the last few months and appears to be heading down. How much further will it go?
Position: Sell
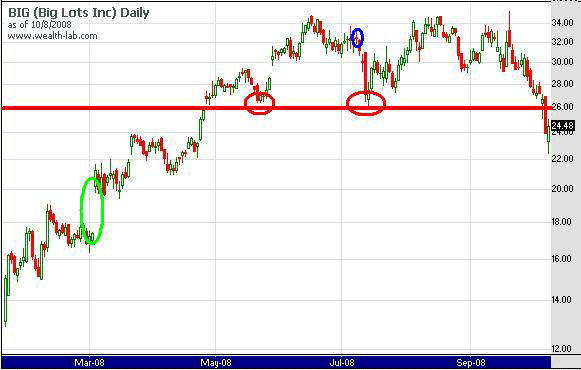
| On July 9, 2008, "A Big Short On Big Lots," I suggested that "this seems to be a good opportunity in which to short [shares of] BIG." After an initial drop from $32 to $26, the stock rebounded into a position in which it again looked suitable to initiate and short positions that may have been closed. Having now convincingly broken beneath the July low of $26, it seems to be a suitable time to see where BIG may be headed. |
| Before discussing a price target, we have to enter stops to protect any existing gains or newly established positions. The red circles show the times where BIG has set up $26 as a support/resistance zone. The old support level of $26 now turns into a resistance level, so you may wish to have stops close to $26. |

|
| FIGURE 1: BIG, DAILY. The red circles show the times where BIG has set up $26 as a support/resistance zone. |
| Graphic provided by: Wealth-lab. |
| |
| BIG has a historical tendency to create and subsequently fill large gaps. From 1990 on, there are eight gaps over 10% that we filled within a year and only two that were not. The green circle shown in Figure 1 is a big gap of roughly 22% that was formed in May. If history is to be any guide, then there is an 80% chance that BIG will close this gap in at most the next few months. The low end of the gap — and hence the price target — is $17.45. At BIG's current price, that is roughly $2.00 of risk for $7.00 of reward. |
Mr. Kupfer is a market professional and amateur stock market commentator. Disclosure: It is likely that Mr. Kupfer has or will enter a position in any security he writes about.
Click here for more information about our publications!
Comments
Date: 10/14/08Rank: 5Comment:

Request Information From Our Sponsors
- StockCharts.com, Inc.
- Candle Patterns
- Candlestick Charting Explained
- Intermarket Technical Analysis
- John Murphy on Chart Analysis
- John Murphy's Chart Pattern Recognition
- John Murphy's Market Message
- MurphyExplainsMarketAnalysis-Intermarket Analysis
- MurphyExplainsMarketAnalysis-Visual Analysis
- StockCharts.com
- Technical Analysis of the Financial Markets
- The Visual Investor
- VectorVest, Inc.
- Executive Premier Workshop
- One-Day Options Course
- OptionsPro
- Retirement Income Workshop
- Sure-Fire Trading Systems (VectorVest, Inc.)
- Trading as a Business Workshop
- VectorVest 7 EOD
- VectorVest 7 RealTime/IntraDay
- VectorVest AutoTester
- VectorVest Educational Services
- VectorVest OnLine
- VectorVest Options Analyzer
- VectorVest ProGraphics v6.0
- VectorVest ProTrader 7
- VectorVest RealTime Derby Tool
- VectorVest Simulator
- VectorVest Variator
- VectorVest Watchdog
