HOT TOPICS LIST
- MACD
- Fibonacci
- RSI
- Gann
- ADXR
- Stochastics
- Volume
- Triangles
- Futures
- Cycles
- Volatility
- ZIGZAG
- MESA
- Retracement
- Aroon
INDICATORS LIST
LIST OF TOPICS
PRINT THIS ARTICLE
by James Kupfer
The US Dollar Index is forming a divergence with the relative strength index. Is this a warning?
Position: Sell
James Kupfer
Mr. Kupfer is a market professional and amateur stock market commentator. Disclosure: It is likely that Mr. Kupfer has or will enter a position in any security he writes about.
PRINT THIS ARTICLE
RSI
The Dollar Divergence
10/13/08 09:10:59 AMby James Kupfer
The US Dollar Index is forming a divergence with the relative strength index. Is this a warning?
Position: Sell
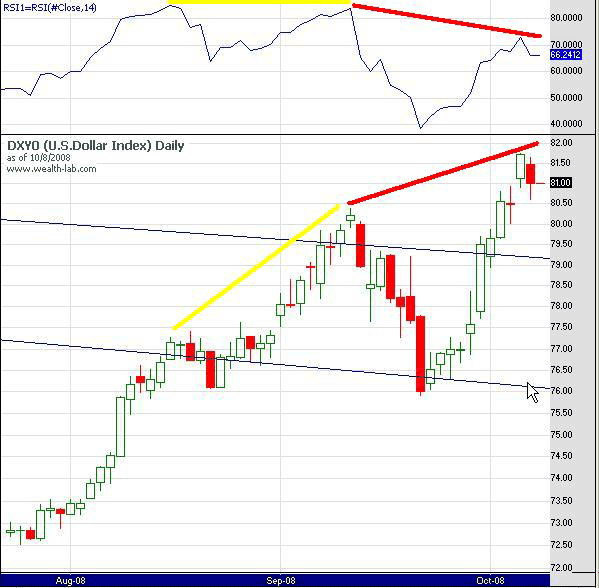
| The US dollar has been in a fierce uptrend since July 2008. Recently, however, the relative strength index (RSI) has started to diverge with the price action in the dollar. This could well be a precursor of future weakness. |
| The RSI is a popular momentum indicator that gauges the relative strength of gains or losses in a security. Generally, it is best to see the RSI continually increasing when the price of a security is increasing as well. Just like with a stock, it is best to see a pattern of higher highs and higher lows. |
| On Figure 1, you will see two sets of lines. Starting with the yellow lines, you can see in the price pane that prices were moving up steadily. However, the line in the RSI pane was flat. This is the first divergence. The second divergence occurred where the red lines indicate. Prices have moved up to a new high, but RSI has not reached a commiserate new high. While a RSI divergence with price is not a sell signal by itself, it is a flashing light warning that something may be wrong. |

|
| FIGURE 1: US DOLLAR, DAILY. With the yellow lines, you can see in the price pane that prices were moving up steadily, but the line in the RSI pane was flat. |
| Graphic provided by: Wealth-lab. |
| |
| It is also interesting to note that the dollar index is only about a point away from overhead resistance in the form of a descending 61.8% Fibonacci fanline (not shown). Two previous Fibonacci fan levels at 38.2% and 50% are shown in blue. Note the price action at each level, which would indicate that prices are affected by the fan lines to at least a minimal degree. |
| Combine the RSI divergence with the approach of the Fibonacci fanline and it is a clear warning that prices might move downward in at least the near term. |
Mr. Kupfer is a market professional and amateur stock market commentator. Disclosure: It is likely that Mr. Kupfer has or will enter a position in any security he writes about.
Click here for more information about our publications!
Comments
Date: 10/14/08Rank: 5Comment:

Request Information From Our Sponsors
- VectorVest, Inc.
- Executive Premier Workshop
- One-Day Options Course
- OptionsPro
- Retirement Income Workshop
- Sure-Fire Trading Systems (VectorVest, Inc.)
- Trading as a Business Workshop
- VectorVest 7 EOD
- VectorVest 7 RealTime/IntraDay
- VectorVest AutoTester
- VectorVest Educational Services
- VectorVest OnLine
- VectorVest Options Analyzer
- VectorVest ProGraphics v6.0
- VectorVest ProTrader 7
- VectorVest RealTime Derby Tool
- VectorVest Simulator
- VectorVest Variator
- VectorVest Watchdog
- StockCharts.com, Inc.
- Candle Patterns
- Candlestick Charting Explained
- Intermarket Technical Analysis
- John Murphy on Chart Analysis
- John Murphy's Chart Pattern Recognition
- John Murphy's Market Message
- MurphyExplainsMarketAnalysis-Intermarket Analysis
- MurphyExplainsMarketAnalysis-Visual Analysis
- StockCharts.com
- Technical Analysis of the Financial Markets
- The Visual Investor
