HOT TOPICS LIST
- MACD
- Fibonacci
- RSI
- Gann
- ADXR
- Stochastics
- Volume
- Triangles
- Futures
- Cycles
- Volatility
- ZIGZAG
- MESA
- Retracement
- Aroon
INDICATORS LIST
LIST OF TOPICS
PRINT THIS ARTICLE
by Chaitali Mohile
After the breakdown, S&P Midcap SPDR has lowered substantially.
Position: Sell
Chaitali Mohile
Active trader in the Indian stock markets since 2003 and a full-time writer. Trading is largely based upon technical analysis.
PRINT THIS ARTICLE
CHART ANALYSIS
S&P Midcap SPDR Hammered Badly
10/09/08 01:12:02 PMby Chaitali Mohile
After the breakdown, S&P Midcap SPDR has lowered substantially.
Position: Sell
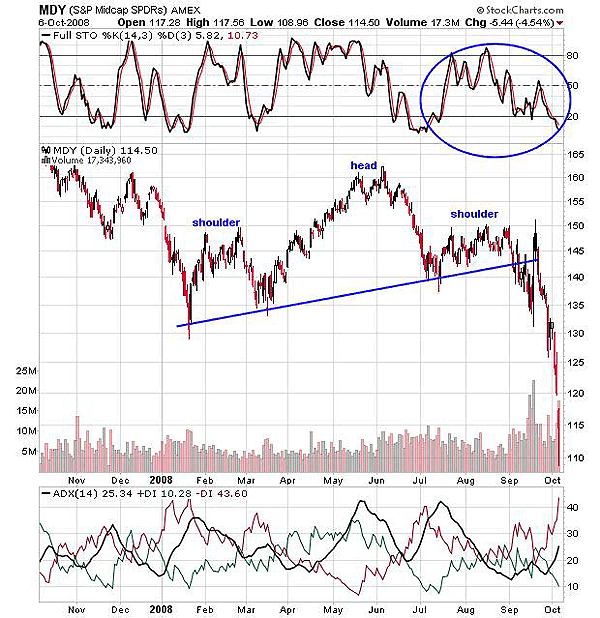
| Figure 1 is the daily chart of S&P Midcap SPDR (MDY) with one-year data. Here, we can see the head & shoulders bearish reversal pattern with an ascending neckline support. The pattern broke down at 145 levels and the index tumbled to 120. During the formation of the right shoulder, the trend reversed and fell. The average direction movement index (ADX) (14) in Figure 1 shows that the downtrend turned stronger with the pattern breakdown. Huge short-selling opportunity was generated with the fresh decline, and soon, the index reached closer to the target level of 115. The distance from neckline to highest peak (head) is 165 - 140 = 25, measured to identify the target; we subtracted the distance from a breakdown level (140), and the minimum estimated level was 115. The index gapped down at 120 and approached the target accurately. but the crash continued even further, hitting at a new low of 108. |
| The bulls were beaten badly, and bearish momentum can drag down the index. Although the stochastic (14,3,3) is oversold, a minor pullback may fail under the bearish conditions. Hence, the traders with a short trade can hold onto the positions with a stop-loss at 120, and since we are in a classic bear market, any pullback rally can be used for fresh short trades. |

|
| FIGURE 1: MDY, DAILY. The head & shoulders bearish reversal pattern has broken. MDY entered a fresh downtrend after the breakdown. |
| Graphic provided by: StockCharts.com. |
| |
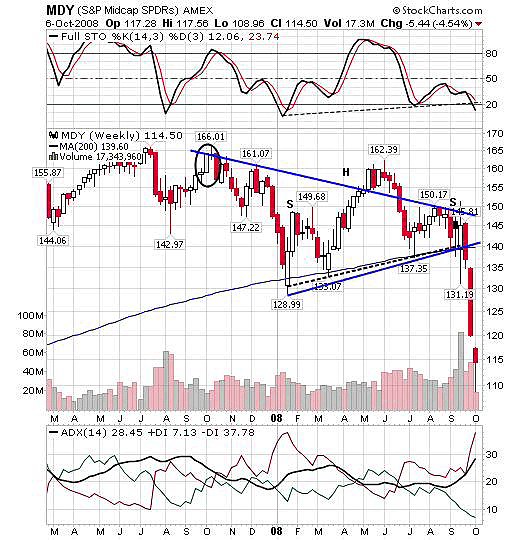
| The weekly chart (Figure 2) shows a major breakdown of a symmetrical triangular pattern, and also the head & shoulders pattern. In a symmetrical triangle, the future direction of the market is uncertain, so the trading becomes highly risky. In Figure 2, the upper trendline shows lower highs, but the series of lower peaks was terminated. The efforts were made to hit the previous high, but due to the lack of bullish participation, the index turned weaker, forming the next lower peak. The head & shoulder pattern explained earlier is reflected in Figure 2. The lower trendline of a symmetrical triangle and the neckline support together form robust support to the declining rally. |

|
| FIGURE 2: MDY, WEEKLY. The symmetrical triangle and the head & shoulders patterns are visible on this chart. |
| Graphic provided by: StockCharts.com. |
| |
| The index had breached two support lines; the 200-day moving average (MA) and the lower trendline. The breakdown increased the bearish pressure and MDY tumbled. On a weekly basis, more downside is visible as the head & shoulders formed by stochastic (14,3,3) is likely to break down. In addition, the target on symmetrical triangle shows new lows: 166 - 129 = 37 (length of triangle), 140 (breakout) - 37 = 103 is the minimum estimated levels. |
| Hence, traders can enter fresh short positions with the target of 103. MDY is badly hammered and its freefall is not yet complete. |
Active trader in the Indian stock markets since 2003 and a full-time writer. Trading is largely based upon technical analysis.
| Company: | Independent |
| Address: | C1/3 Parth Indraprasth Towers. Vastrapur |
| Ahmedabad, Guj 380015 | |
| E-mail address: | chaitalimohile@yahoo.co.in |
Traders' Resource Links | |
| Independent has not added any product or service information to TRADERS' RESOURCE. | |
Click here for more information about our publications!
PRINT THIS ARTICLE

Request Information From Our Sponsors
- StockCharts.com, Inc.
- Candle Patterns
- Candlestick Charting Explained
- Intermarket Technical Analysis
- John Murphy on Chart Analysis
- John Murphy's Chart Pattern Recognition
- John Murphy's Market Message
- MurphyExplainsMarketAnalysis-Intermarket Analysis
- MurphyExplainsMarketAnalysis-Visual Analysis
- StockCharts.com
- Technical Analysis of the Financial Markets
- The Visual Investor
- VectorVest, Inc.
- Executive Premier Workshop
- One-Day Options Course
- OptionsPro
- Retirement Income Workshop
- Sure-Fire Trading Systems (VectorVest, Inc.)
- Trading as a Business Workshop
- VectorVest 7 EOD
- VectorVest 7 RealTime/IntraDay
- VectorVest AutoTester
- VectorVest Educational Services
- VectorVest OnLine
- VectorVest Options Analyzer
- VectorVest ProGraphics v6.0
- VectorVest ProTrader 7
- VectorVest RealTime Derby Tool
- VectorVest Simulator
- VectorVest Variator
- VectorVest Watchdog
